
Fig 7.
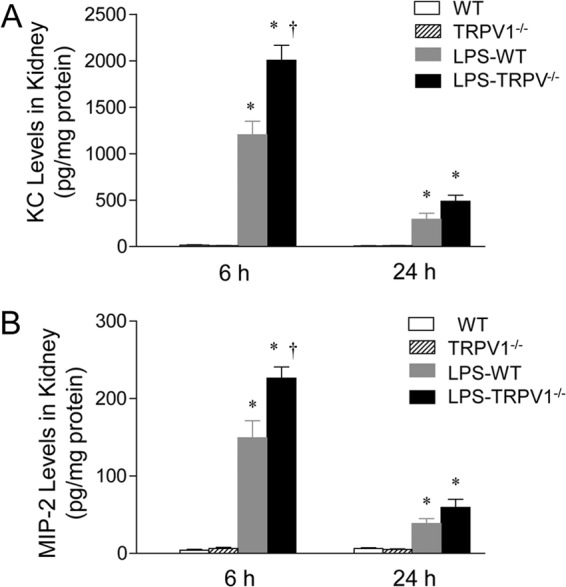
Effect of lipopolysaccharide (LPS) treatment on renal chemokine KC (A) and MIP-2 (B) levels in wild-type (WT) and TRPV1-null mutant (TRPV1−/−) mice. Tissue samples were collected at 6 or 24 h after intraperitoneal injection of vehicle or LPS (5 million endotoxin units/kg). Values are means ± SE (n = 6 to 8). *, P value of <0.05 compared with control WT or TRPV1−/− mice; †, P value of <0.05 compared with LPS-treated WT mice.