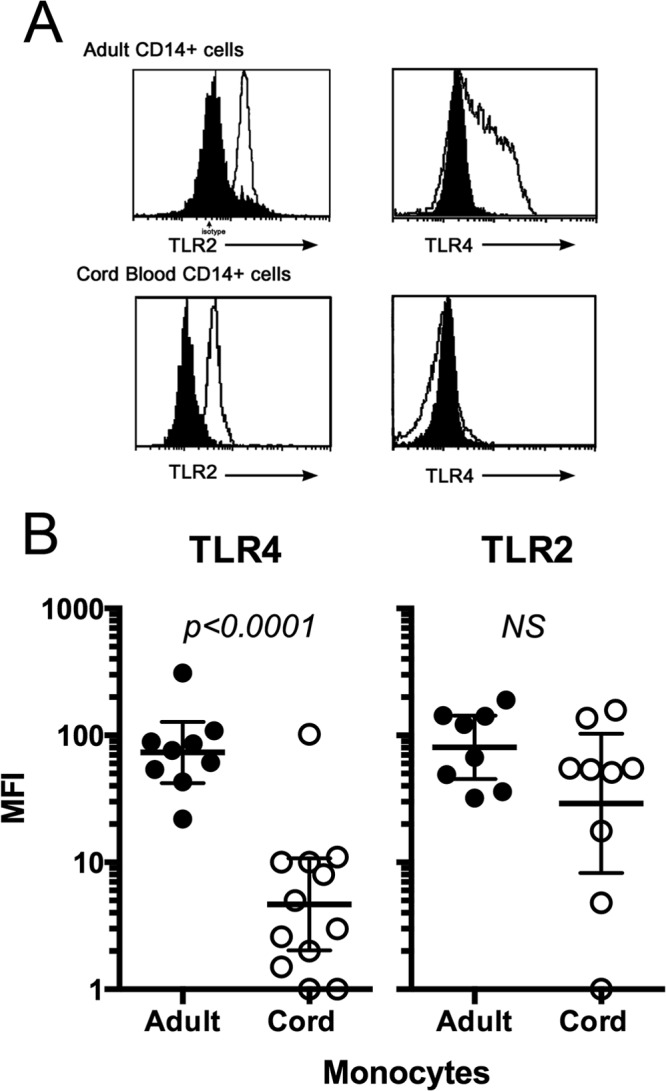
Fig 2.

Ex vivo TLR4 and TLR2 expression on CD14+ cord blood versus adult blood monocytes, assessed by flow cytometry. (A) Representative flow cytometry histograms for TLR2 and TLR4 gated on CD14+ lymphocytes from freshly prepared PBMCs. The dark histogram represents the isotype control. (B) The relative mean fluorescence intensities (MFI) for TLR4 for individual adult (closed circles) and cord (open circles) blood samples are shown. Values were calculated as net MFI or MFITLR4 or MFITLR2 minus MFIisotype control. Bars indicate means ± SD. There was a significant difference in net MFI between adults and neonates for TLR4 (P < 0.001) but not for TLR2 (P = 0.12).
