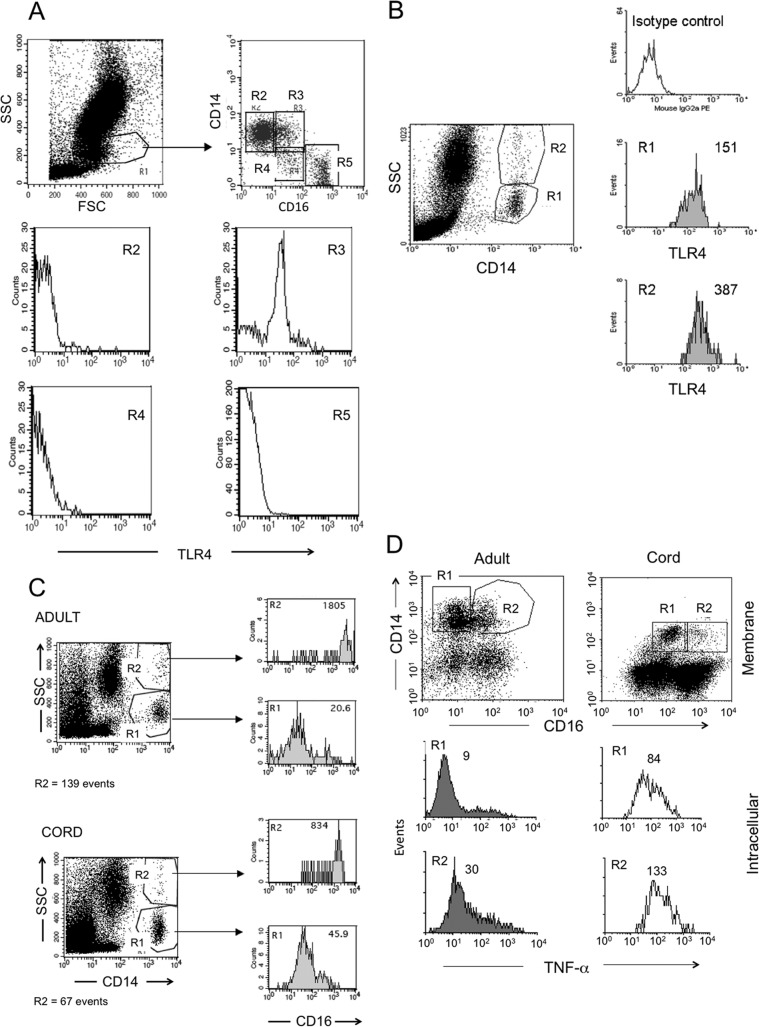
Fig 4.
(A, B, D) CD14+ CD16+ (A) and CD14+ granular (B) cells express more TLR4 than CD14+ CD16− and lower granular cells and produce more LPS-induced TNF-α than CD14+ CD16− monocytes (D). (A) Fresh whole blood from an adult donor was stained with CD16-FITC, CD14-PE, and TLR4-TC, monocytes initially gated by morphology (forward scatter [FSC] versus SSC, R1) were plotted for CD16 and CD14 (upper right) to select distinct regions (R2, R3, R4, and R5), and each region was analyzed for TLR4 expression (lower histograms; the highest TLR4 expression was in R3). Similar staining patterns were found in cord blood cells, with higher TLR4 on CD14+ CD16+ monocytes. (B) TLR4 expression on low granular CD14+ (R1) and high granular CD14+ (R2) monocytes in fresh whole blood from an adult. (C) Granular CD14+ (R2) monocytes express higher levels of CD16+ than low granular CD14 (R1) monocytes from adult and cord whole blood. (D) Mononuclear cells were obtained from adult and cord blood, stimulated with 1 ng/ml LPS in the presence of brefeldin A, and incubated for 5 h; CD14 and CD16 were labeled on membranes and intracellularly for TNF-α, and cells were analyzed by flow cytometry. CD14+ CD16+ monocytes produced more TNF-α than CD14+ CD16− monocytes in response to LPS, as shown for adult and cord blood cells. Numbers on histograms represent geometric mean fluorescence intensity for the assessed molecule in the indicated region. Each of the flow cytometry experiments described above was performed on samples from at least 3 individuals with similar results.

