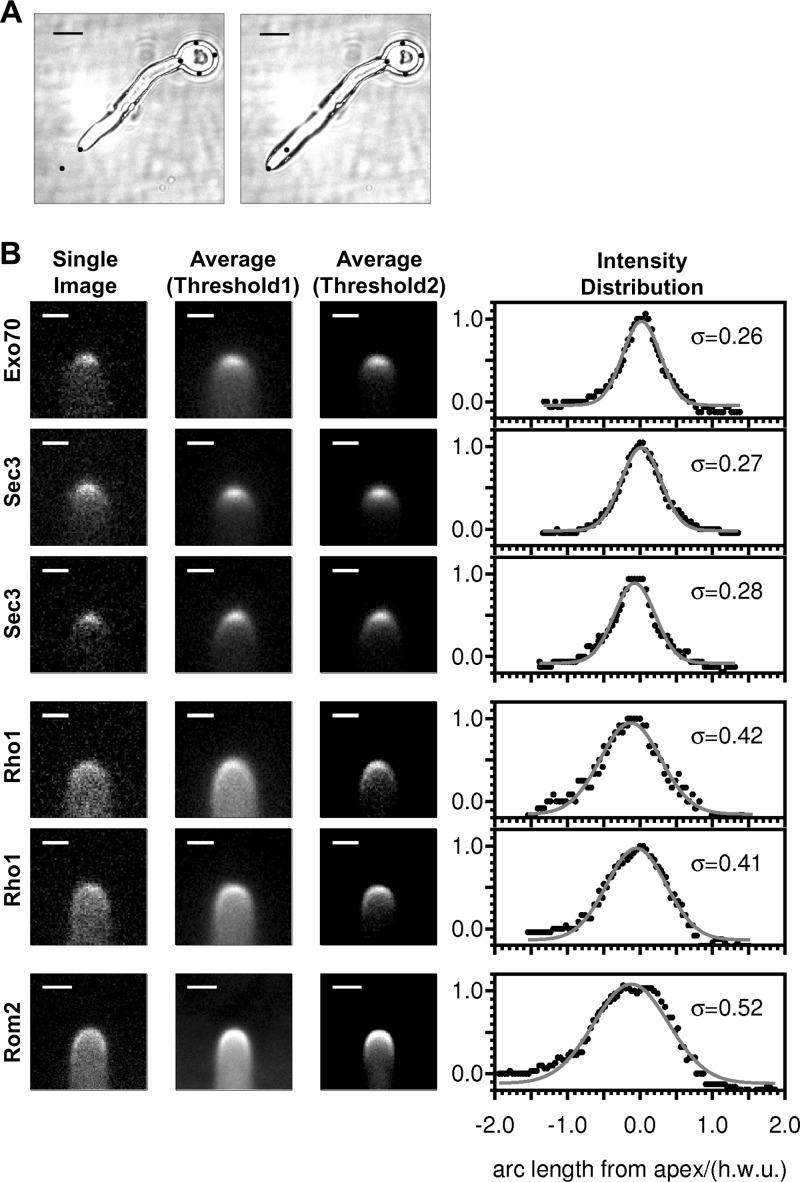
Fig 1.
Quantitation of protein distributions. (A) Differential interference contrast images showing the growth of a C. albicans hypha from time zero (left) to 10 min (right). The marker spots are at the same positions in the two images and show that the mother cell body does not move significantly in this time, while the tip moves through approximately 2 hyphal diameters. Bar, 5 μm. (B) Fluorescence images and quantitation of fluorescence intensity in live cells. Data are shown from time series for three cells expressing tagged exocyst components (Exo70, Sec3) and two cells expressing tagged Rho1 and from a collection of cells expressing Rom2-GFP. Leftmost panels show representative single images either from the time series (Exo70, Sec3, Rho1) or from a single cell (Rom2), with the minimum intensity set to the background outside the cell (plus 1 standard deviation). Central and right panels show average images from the time series (Exo70, Sec3, Rho1) or from a collection of 42 cell images (Rom2) with two threshold settings. In the central panels, the minimum intensity is set at the background outside the cell (plus 1 standard deviation), whereas in the panels on the right, the minimum intensity is set at the background cytoplasmic level away from the apex. Two thresholds are shown because the cytoplasmic background is much higher in the Rho1 and Rom2 images, obscuring the crescent at the tip. Bars, 1 μm. The graph on the right shows the fluorescence intensity traced around the hyphal tip (black dots) and the fit of these data to Gaussian curves (solid curves), plotted against the arc length from the tip of the cell. The value of σ for each fitted curve is shown. The fluorescence data were normalized to 1 at the maximum and to zero far from the apex. The units for arc length and σ are hyphal width units (hwu), in which the width of the hypha is 1 unit (see the text).

