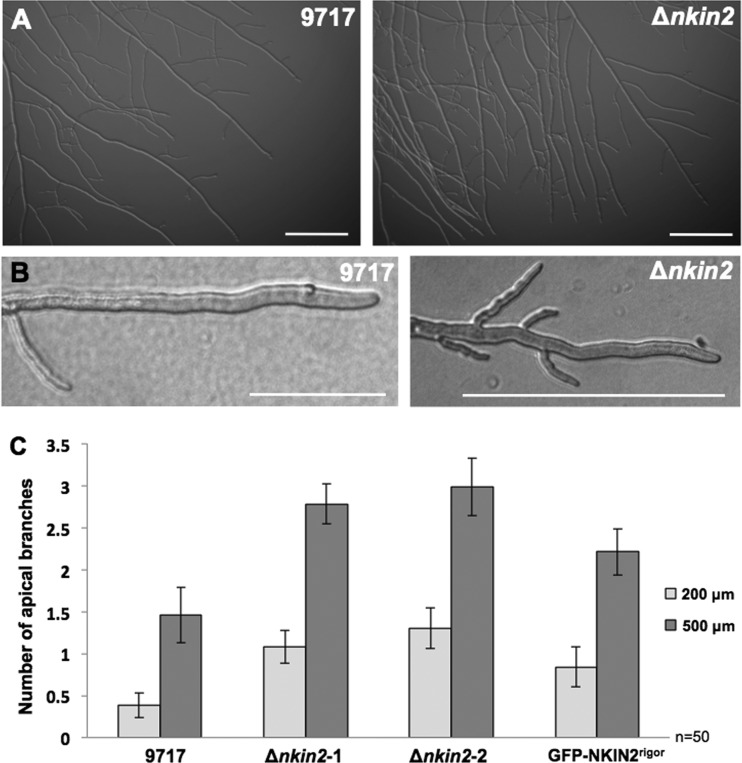
Fig 7.
Analysis of the branching patterns of different NKIN2 mutants. (A) The Δnkin2 strain displays more branches. Scale bar, 200 μm. (B) Examples of the apical hyphal region with branches. (C) Quantification of branching within the first 200 μm and 500 μm away from the tip of leading hyphae of the wild-type strain (N9717), two Δnkin2 strains, and GFP-NKIN2rigor integrated into the his-3 locus of N9717.

