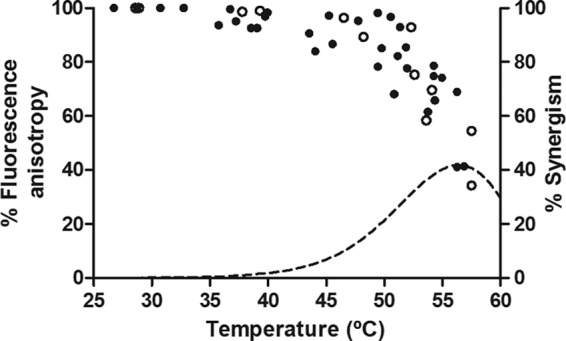
Fig 6.

Percentage of DPH fluorescence anisotropy changes in the E. coli WT strain (solid symbols) and uvrA mutant (open symbols) membrane at different temperatures. Cells were treated for 3.5 min in McIlvaine buffer at temperatures of between 25.0 and 60.0°C. The figure includes the percentage of synergism of UV-H treatments at different temperatures of the E. coli WT strain (dotted line) calculated by equation 2.
