
Fig 1.
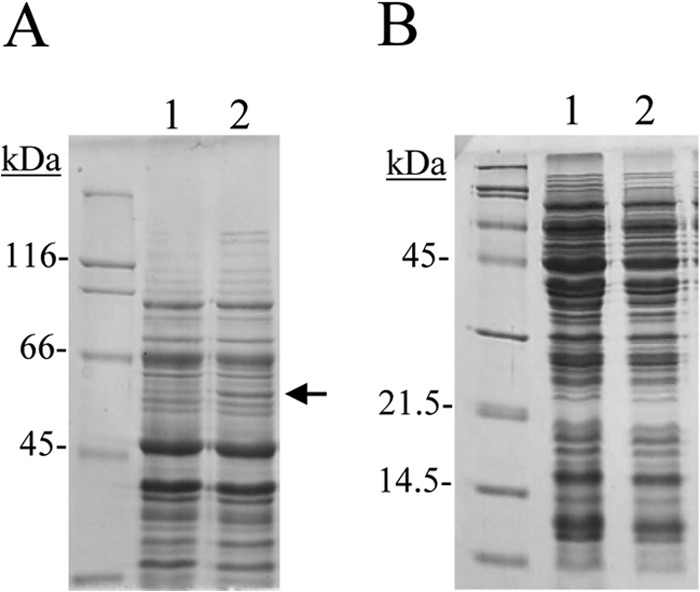
SDS-PAGE analysis of protein extracts from L. plantarum WCFS1 grown in the presence of 3 mM gallic acid. Lanes 1, uninduced cell extracts; lanes 2, extracts induced with gallic acid for 1 h. The arrow indicates the induced protein. The 8% (A) and 15% (B) gels were stained with Coomassie blue. Molecular mass markers are located on the left (SDS-PAGE standards; Bio-Rad).