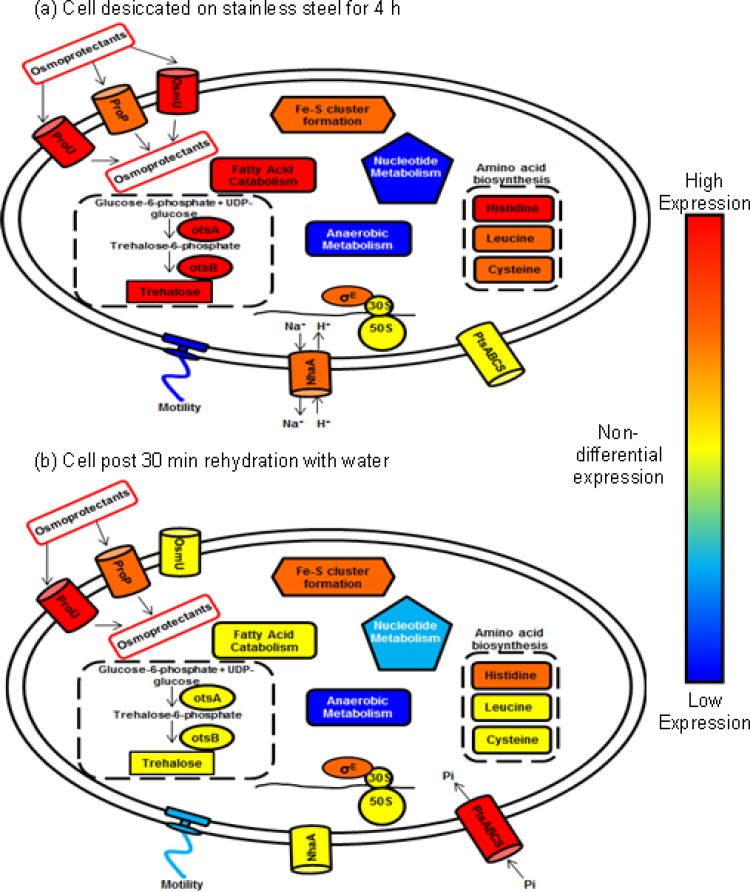
Fig 5.
Proposed model of cellular changes occurring during desiccation of a cell on steel for 4 h (a) and during rehydration of a desiccated cell with water (b). Each symbol represents a range of genes involved in particular physiological or regulatory processes. Blue indicates decreased expression; yellow indicates genes that were expressed at similar levels in the planktonic control bacteria; and red indicates increased expression.

