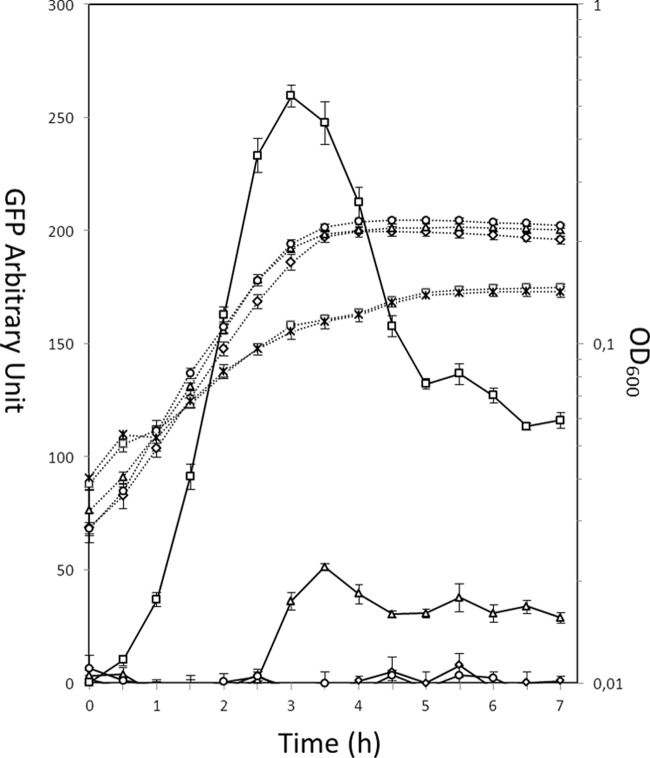
Fig 2.
Growth (dotted lines) and GFP expression level (solid lines) after induction with 0.5 mM zinc at different time points. NZ9000(pCZG) induced with ZnSO4 at a final concentration of 0.5 mM at 0 h (□), 2 h (△), and 4 h (○). Two control strains were run in parallel: NZ9000(pNZ8048) uninduced (◇) and induced with 0.5 mM ZnSO4 at 0 h (×). The values represent the means from three independent measurements.

