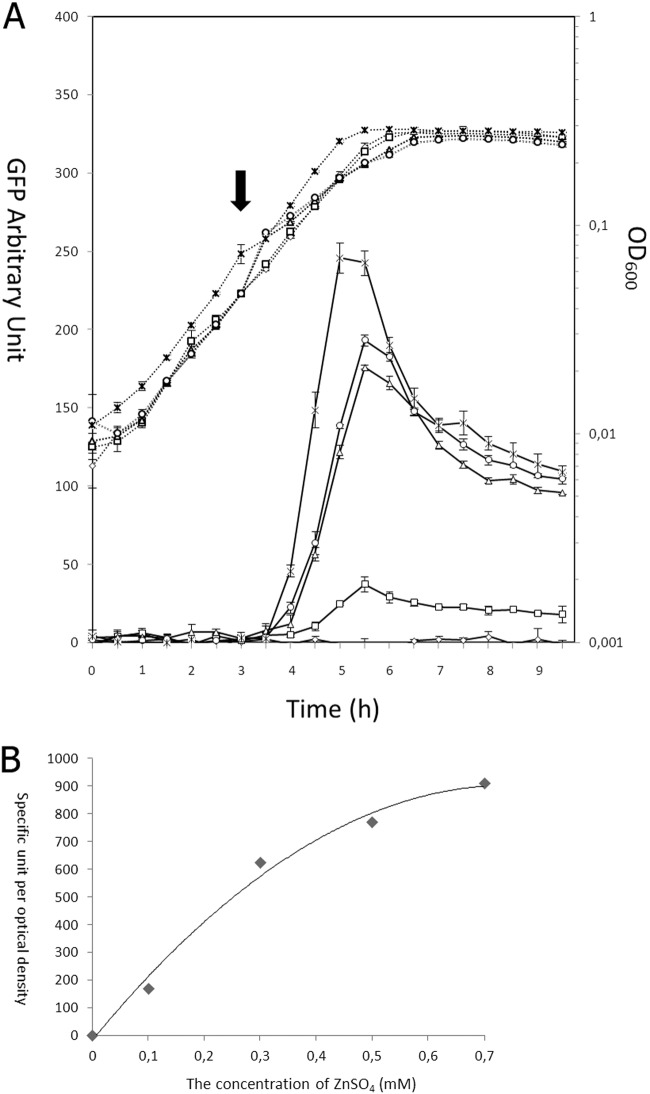
Fig 3.
(A) Growth (dotted lines) and GFP intensity (solid lines) after induction with different zinc concentrations. L. lactis NZ9000(pCZG) was induced at an OD600 of 0.06 with different concentrations of ZnSO4: 0 (◇), 0.1 mM (□), 0.7 mM (△), or 1.0 mM (○). A control, NZ9000(pNZ8048G) (×), induced with 5 ng/ml of nisin was also used to compare the production levels of PczcD and PnisA. The arrow indicates the time point for induction. These values represent the means from three independent measurements. (B) Dose-response curve of GFP expression of L. lactis NZ9000(pCZG). Fluorescent signal is shown as specific units per OD600. The fluorescent signal changed less sensitively at the concentration of ZnSO4 above 0.3 mM. The standard errors are less than 15% for each value.

