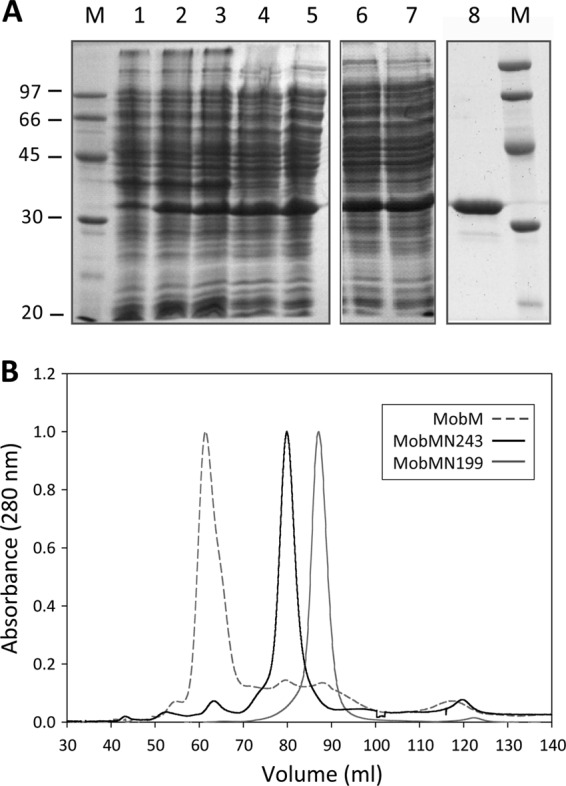
Fig 2.

Overexpression and purification of the MobMN243 protein. (A) Fractions from the different purification steps of MobMN243 were analyzed by electrophoresis on 12% SDS-PAGE gels. Samples were loaded in the following order: noninduced cultures (lane 1), cultures after induction with IPTG (lane 2) and rifampin (lane 3), supernatant of a total cell lysate (lane 4), supernatant after polyethyleneimine precipitation (lane 5), supernatant of the ammonium sulfate precipitation step dialysis against buffer A plus 300 mM NaCl (lane 6), and protein soluble fraction after dialysis (lane 7). The sample was loaded onto a heparin-agarose column and then subjected to a gel filtration column (lane 8). M indicates the molecular mass standards (in kDa). (B) Comparative analysis of the gel filtration elution profiles of MobM (gray dashed line), MobMN243 (continuous black line), and MobMN199 (continuous gray line) subjected to 1 ml/min isocratic flow (buffer A plus 300 mM NaCl) in a HiLoad Superdex 200 column.
