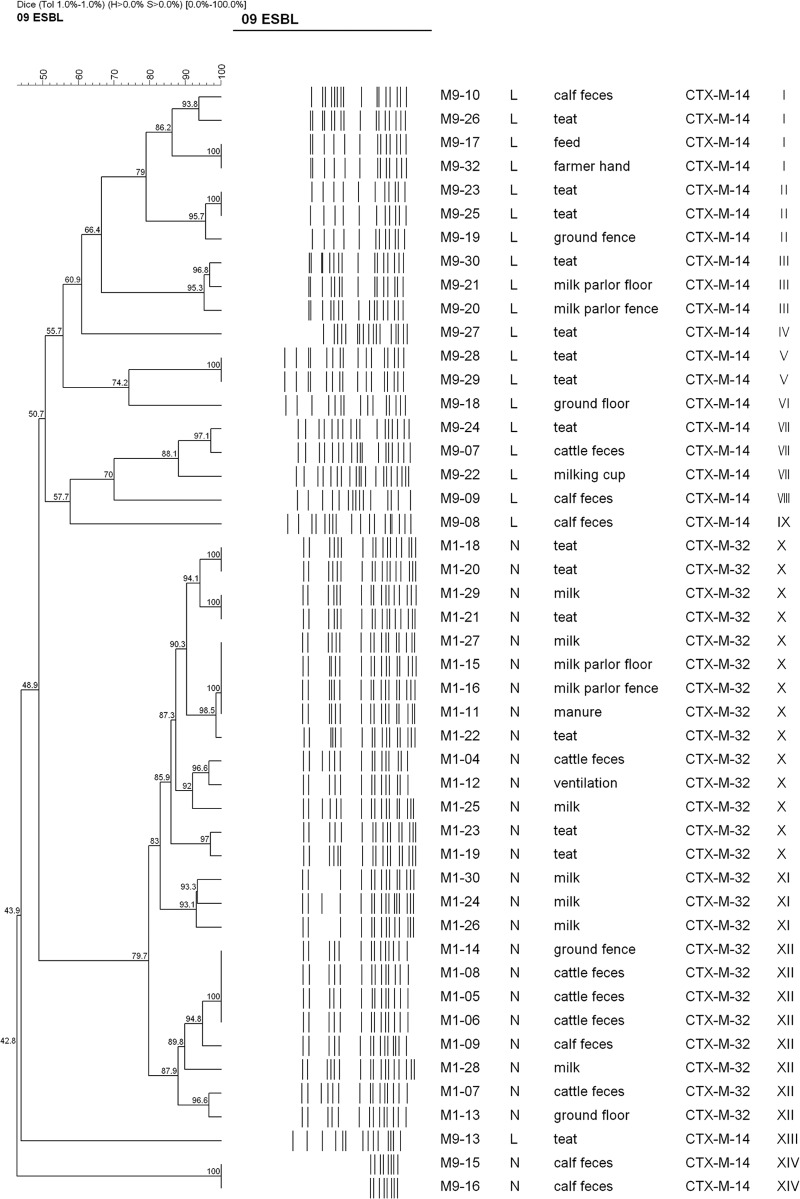
Fig 1.
Dendrogram showing the cluster analysis of XbaI PFGE patterns of 47 CTX-M-producing E. coli strains isolated from cattle, farm workers, and the farm environment in the Republic of Korea. The cluster analysis was performed by using the Dice coefficient and the unweighted-pair group method with arithmetic averages. Details given in the first two columns are % similarity and PFGE banding pattern, respectively. The numbers at the nodes indicate % similarity. Details given in the third through seventh columns from the left are the strain number, farm investigated, source of isolation of the blaCTX-M gene, CTX-M type, and pulsotype for each strain. XbaI macrorestriction analysis yielded few or no DNA banding patterns in the two E. coli strains due to constant autodigestion of the genomic DNA during agarose plug preparation, and thus, a cluster formed by these strains is ignored throughout this paper.

