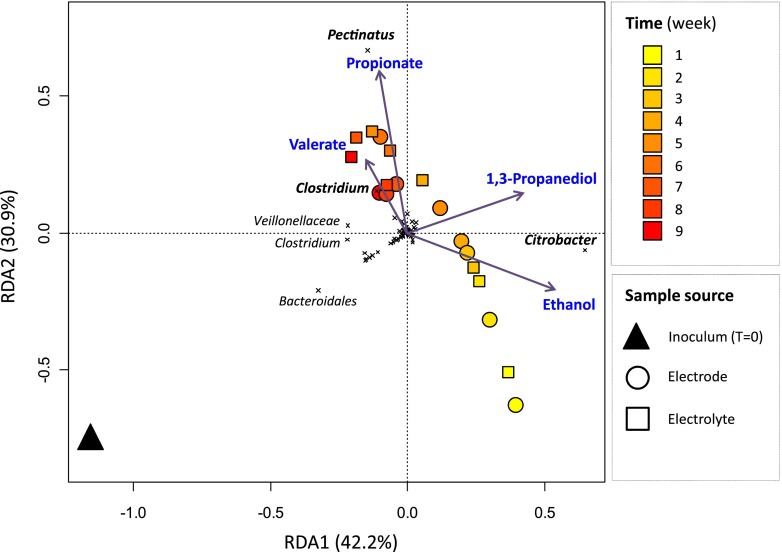
Fig 6.
RDA containing metabolites that were significantly correlated with variation in the composition of microbial communities. Metabolites that were not significantly correlated with variation in microbial community composition are not shown. The length of the arrows is proportional to the variance in microbial community composition that can be attributed to the constraints. The angle of an arrow reflects its correlation with the axes. The colors of the symbols are proportional to time, and the types of samples are indicated by different shapes as follows: triangle, inoculum; circle, cathodic electrode; square, cathodic electrolyte. Crosses represent bacterial OTUs. For clarity, taxonomic affiliations are shown for the most discriminating OTUs only.

