
Fig 3.
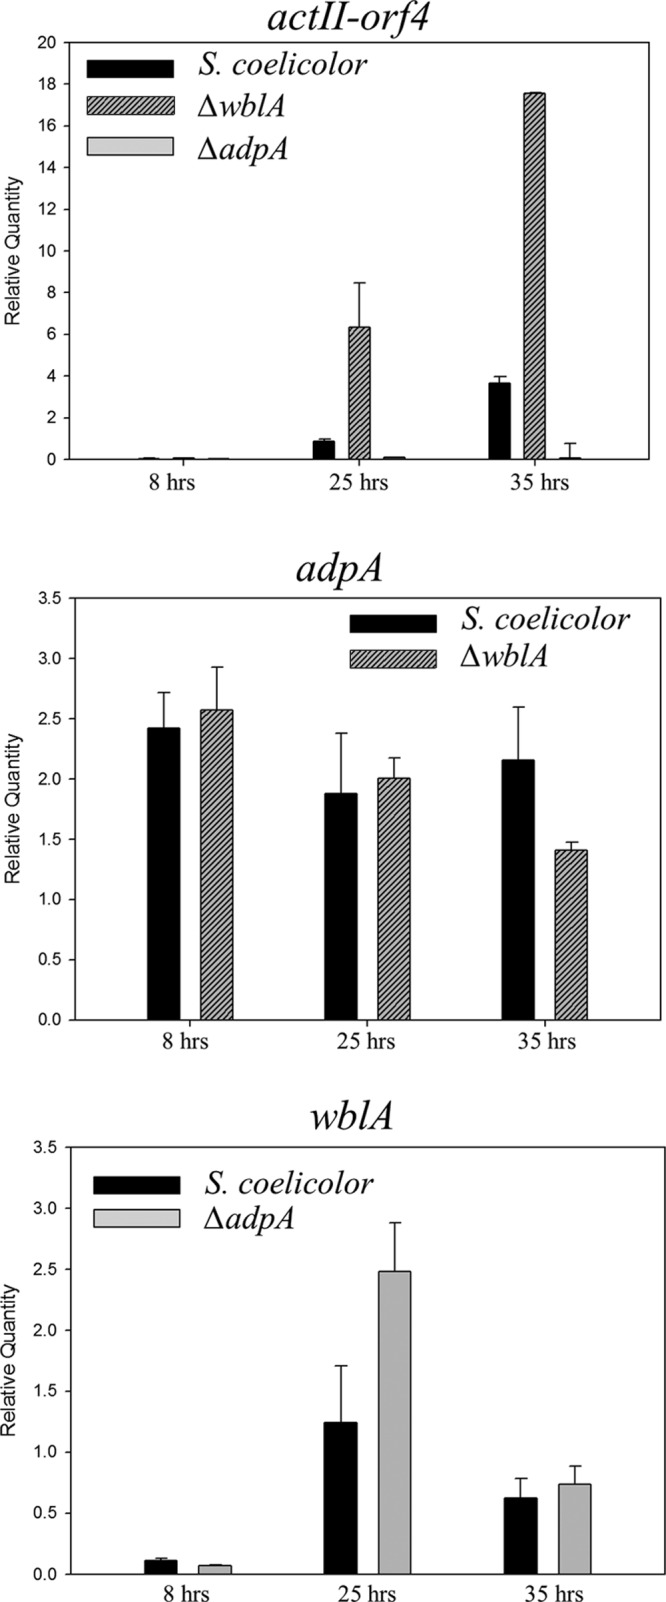
Transcriptional analysis of target genes from S. coelicolor M145, the S. coelicolor ΔadpASC mutant, and the S. coelicolor ΔwblA mutant at different time points (8, 25, and 35 h). All cultures were performed in triplicate, and the averages are shown. The y axis scale represents the expression value relative to that of hrdB, a housekeeping sigma factor (which was set to 1).