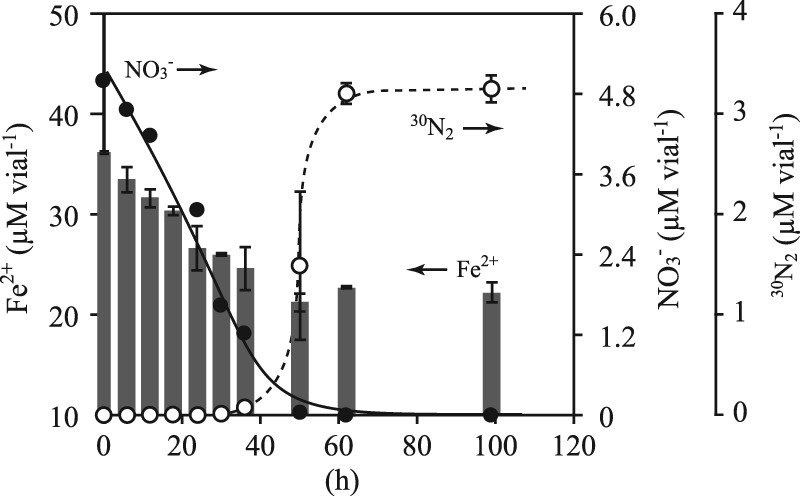
Fig 1.

Oxidation of Fe2+ (gray bars, left y axis) with reduction of 15NO3− (closed circles, right y axis) and production of 30N2 gas (empty circles, right y axis). “Ca. Brocadia sinica” cells (2.5-ml sample in a 5-ml glass vial) were incubated at 37°C with 15NO3− (2.5 mM) and Fe2+ (15 mM). Error bars indicate the range of SDs derived from three replicated vials.
