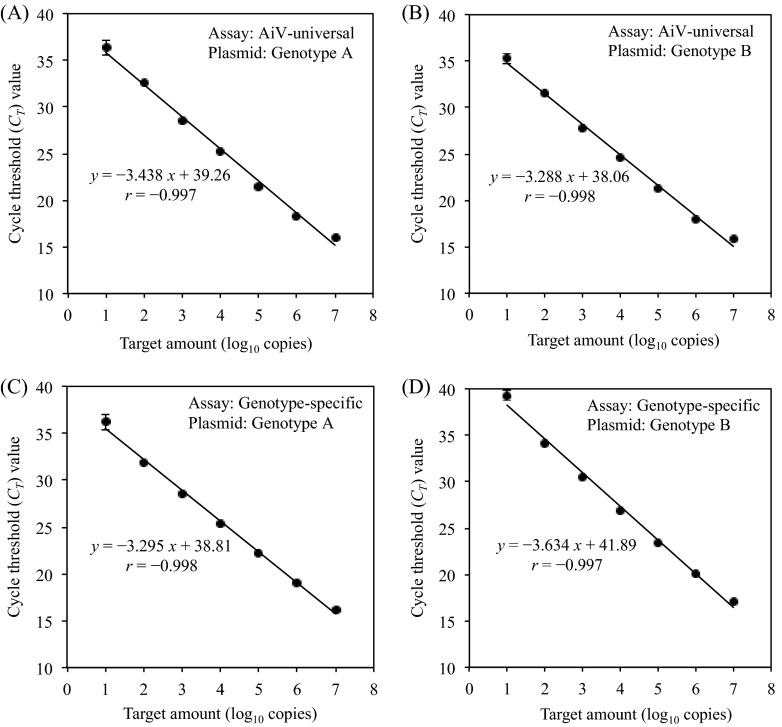
Fig 2.
Relationship between input copy numbers of the standard plasmids and CT values obtained from the AiV universal qPCR assay (A and B) and genotype-specific duplex qPCR assay (C and D) with a serial 10-fold dilution (107 to 101 copies/reaction) of a standard plasmid of AiV genotype A (A and C) or genotype B (B and D). The average CT value of the three reactions is plotted, and error bars indicate standard deviations.

