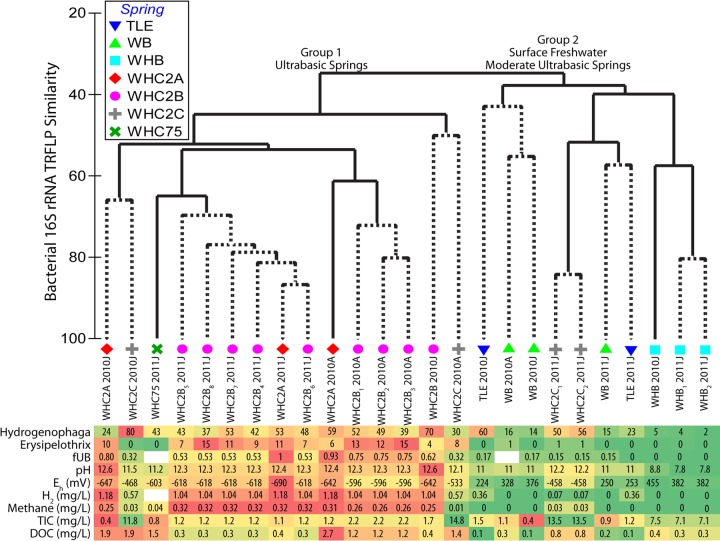
Fig 2.
Dendrogram illustrating bacterial community similarity (as measured by the presence/absence of TRFLP fragment clusters) among samples collected from Tablelands serpentinite springs and surface freshwater. Dotted lines represent samples that could not be distinguished by a SIMPROF test. Subscript numbers indicate replicate samples from the same spring. The abundance levels of Hydrogenophaga and Erysipelothrix in the underlying table reflect the percent relative abundance of the corresponding TRFLP fragment cluster in each sample. Color coding of the table is an arbitrary visual aid to identify the highest and lowest numbers for each variable. Sample names and associated geochemical characteristics correspond to data provided in Table 1.

