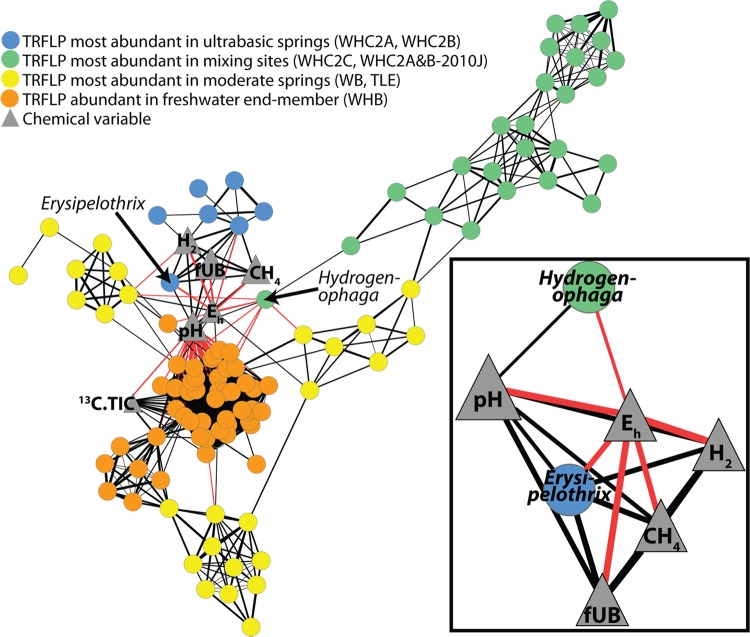
Fig 5.
Association network of the relative abundance of TRFLP fragment clusters and geochemical variables. Each circle is a TRFLP fragment cluster, and its color corresponds to the type of sample in which its relative abundance was greatest (see figure legend). Positive correlations are black lines; negative correlations are red lines; the width of each line is proportional to the r value. All correlations with P values of <0.05 and q levels of <0.05 are shown. The inset shows geochemical correlations only for Hydrogenophaga and Erysipelothrix, which were identified by linking observed TRFLP fragment sizes to predicted restriction sizes of tag sequences. For clarity, taxonomic assignments for other TRFLP fragment clusters are not shown. The six blue circles other than Erysipelothrix represent unidentified TRFLP fragment clusters, which did not constitute more than 3% of the total TRFLP signal in any sample.

