
Fig 2.
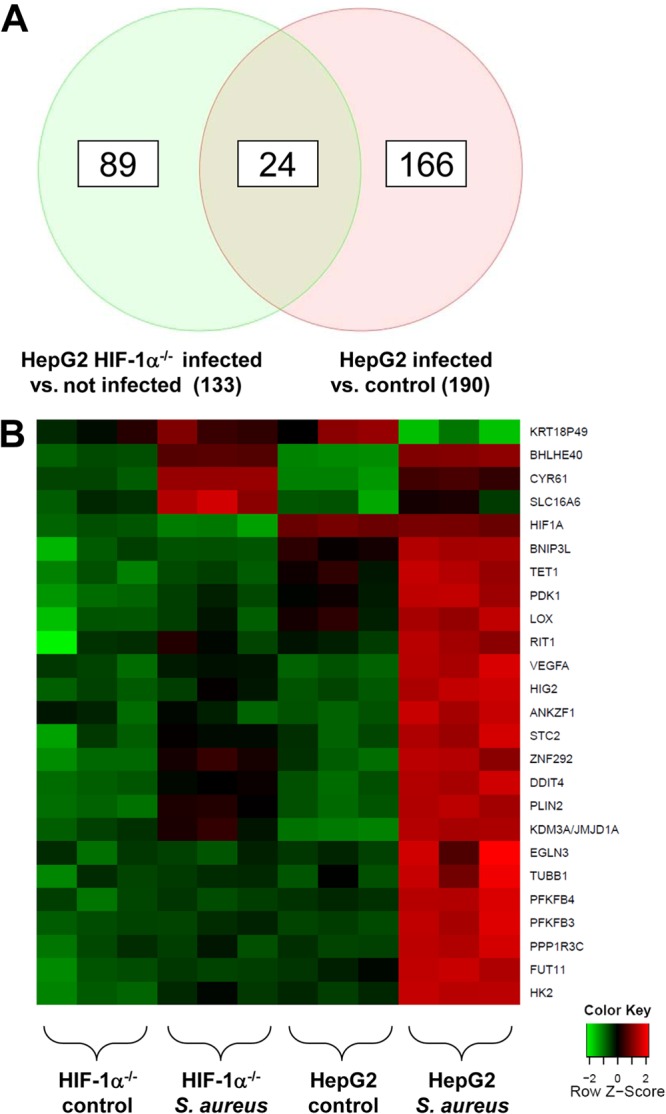
HIF-1-dependent gene expression in HepG2 cells upon S. aureus infection. HepG2 and HepG2 HIF-1α−/− cells were infected with S. aureus (MOI, 20). Four hours after infection, total RNA was isolated, transcribed, and hybridized to Affymetrix Human Gene 1.0 ST arrays (see Materials and Methods). Analysis was performed in triplicate. (A) Venn diagram. After infection, 190 transcripts were regulated in total in HepG2 cells, 133 transcripts were differentially regulated in infected HepG2 HIF-1α−/− cells and infected control cells, and 24 transcripts were regulated by HIF-1. (B) Heat map of HIF-1-regulated genes after S. aureus infection (for details, see Table 1). Cluster analysis for selected probe sets was performed using R2.15.1 software. Signal intensities were scaled and centered, and the distance between two expression profiles was calculated using the Manhattan distance measure. Hierarchical cluster analysis was performed with average linkages. Heat maps were generated with geneplotter in the Bioconductor package.