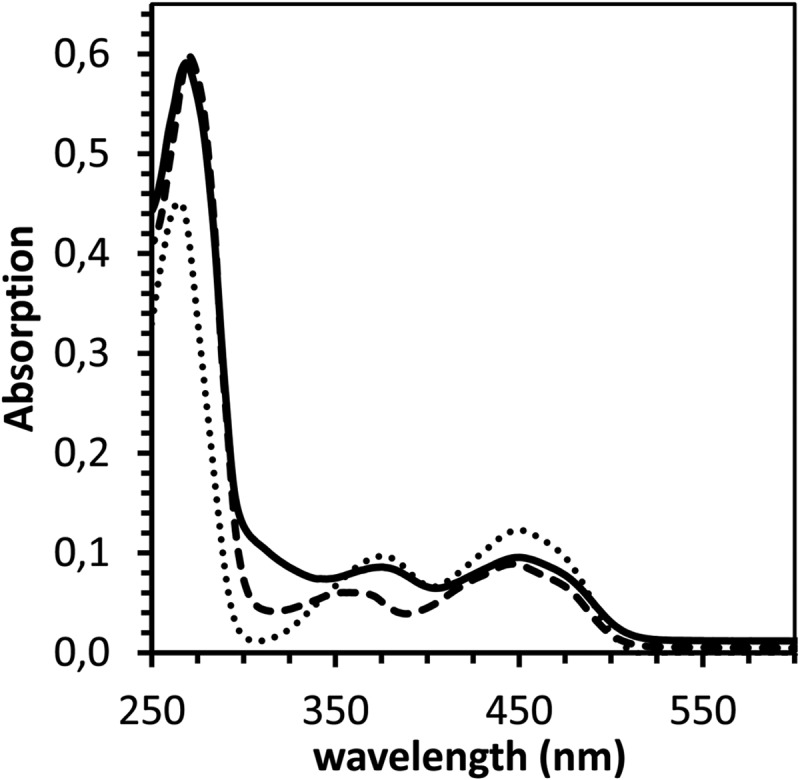
Fig 4.

UV-Vis spectra of ChCoA and Ch1CoA dehydrogenase. Free FAD (dotted line), purified S. aciditrophicus ChCoA dehydrogenase (3.4 μM; dashed line), and heterologously expressed Ch1CoA dehydrogenase (3.2 μM; solid line) are shown. The cofactors/enzymes were all in the oxidized state.
