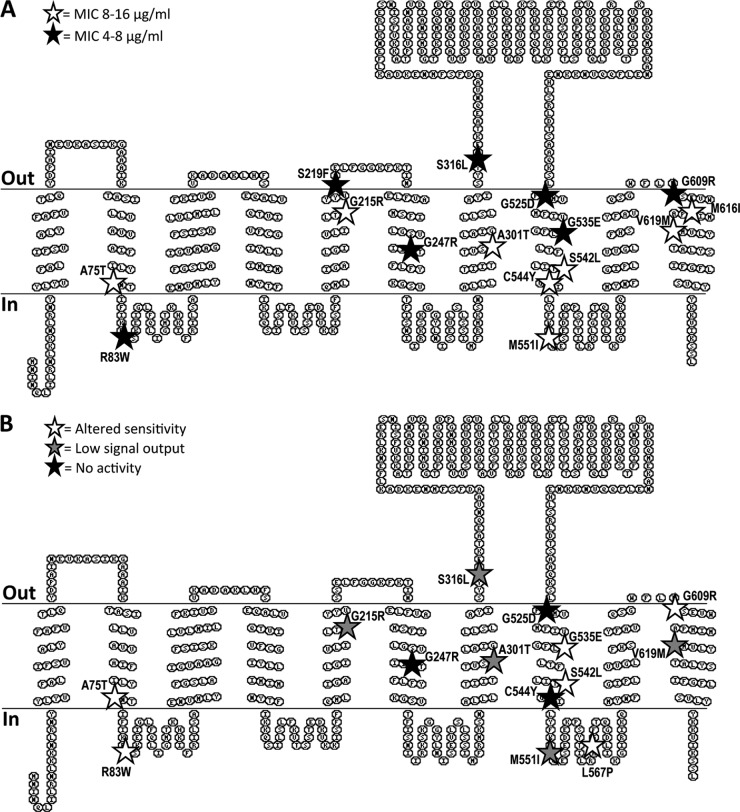
Fig 1.
Distribution of amino acid exchanges in BceB by effects on resistance and signaling. The position of each amino acid exchange in the predicted transmembrane topology of BceB is marked by a star, and the exact exchange is given. Shading of stars is according to the effects of each mutation on bacitracin detoxification (A) or activation of signal transduction (B). Exchanges resulting in wild-type behavior are not shown. Details on the observed phenotypes are given in the text and Table 3. Topology prediction was carried out by MemBrain (30), and the results are displayed using TOPO2 (http://www.sacs.ucsf.edu/). The cytoplasmic membrane is indicated by horizontal lines, and the orientation of the schematic is given on the left.

