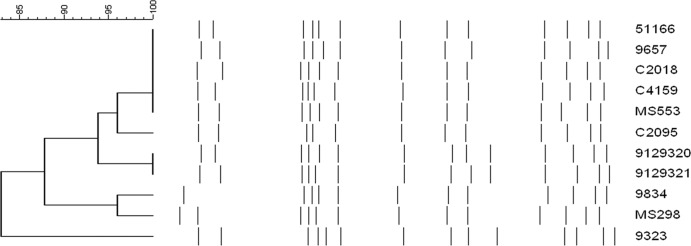
Fig 1.

Analysis of PFGE patterns of ST398 isolates from the Dallas County Jail (C2018, C4159, and C2095; all are spa type t571), New York State Prisons (9657 [t6864], 9834 [t571], and 9323 [t6587]) (30), Chicago colonization isolates (9129320 [t571] and 9129321 [t571]), Northern Manhattan (51166 [t571] and MS553 [t6608], and MS298 [t1451]) (22). Band patterns are compared using the Dice coefficient.
