Fig 2.

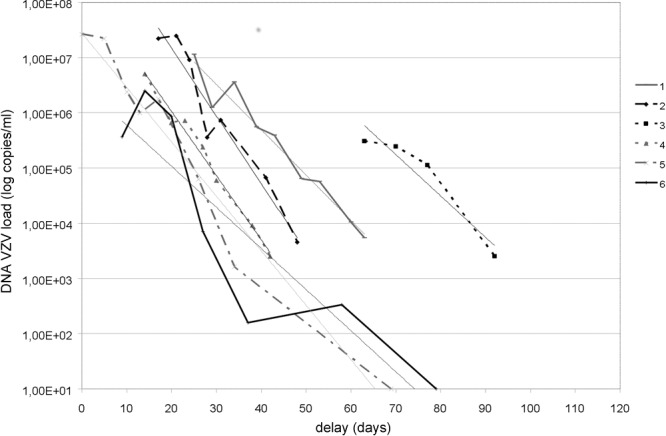
Model of VZV viral loads using a logarithmic decay curve in six patients with acute retinal necrosis. The modelized part of each curve concerns the segment of decreasing DNA load (biological change in viral load defined as 0.5 log).

Model of VZV viral loads using a logarithmic decay curve in six patients with acute retinal necrosis. The modelized part of each curve concerns the segment of decreasing DNA load (biological change in viral load defined as 0.5 log).