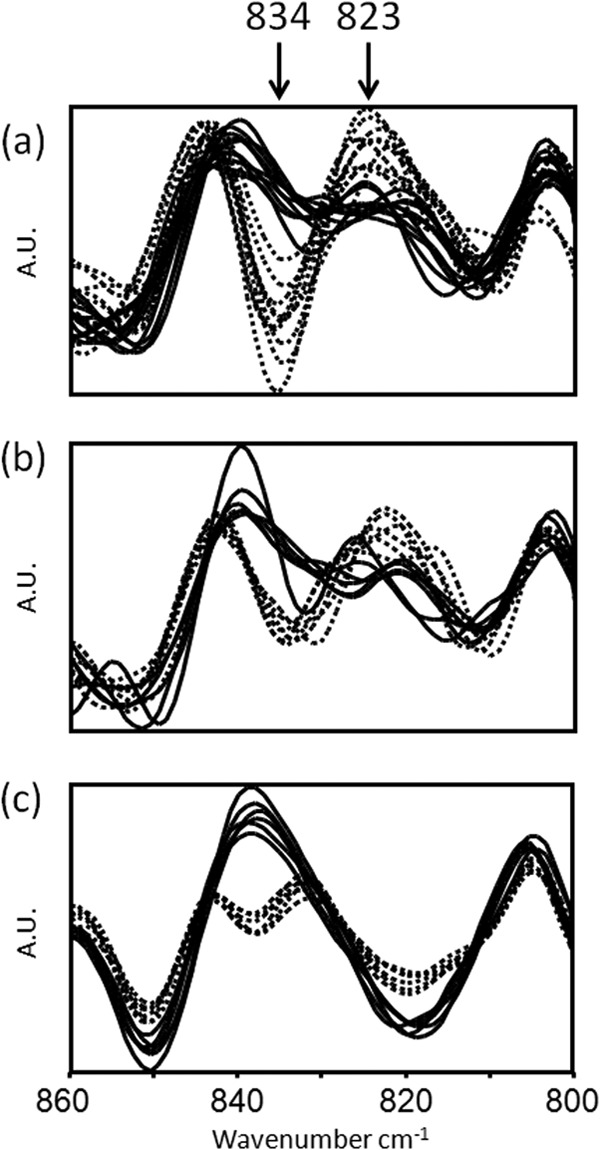
Fig 2.

FTIR spectra of S. aureus intact cells and capsule extracts in the spectral range of 860 to 800 cm−1, showing the discrimination between CP5 (solid line) and CP8 (dashed line) at 834 cm−1 and 823 cm−1. All isolates were grown under standardized conditions on TSA at 30°C for 24 h. (a) Clinical CP5 (n = 10) and CP8 (n = 10) isolates included in the reference data set. Whole bacteria. (b) Reynolds prototype strain CP5 and its isogenic mutant CP8. Whole bacteria. (c) Reynolds prototype strain CP5 and its isogenic mutant CP8. Crude capsule extracts. (b and c) Spectral data derived from three independent experiments. Each experiment was performed in technical duplicates. A.U., arbitrary units.
