
Fig 3.
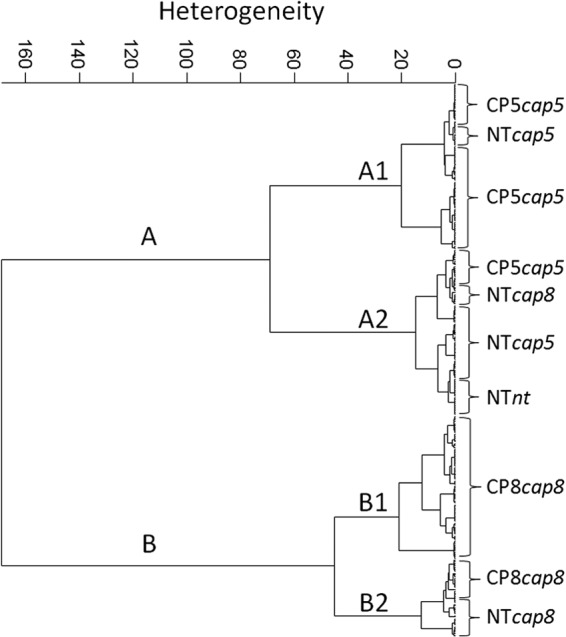
FTIR spectroscopy-based dendrogram of the reference strain set, comprising 10 isolates from serotypes CP5, CP8, and NT. Second derivatives were calculated from 10 replicate spectra of each isolate with a 9-point Savitzky-Golay filter, and subsequent vector normalization was performed for the whole spectral range. Dendrograms were obtained using Ward's algorithm in the spectral range of 1,200 to 800 cm−1 at repro level 30.