
Fig 2.
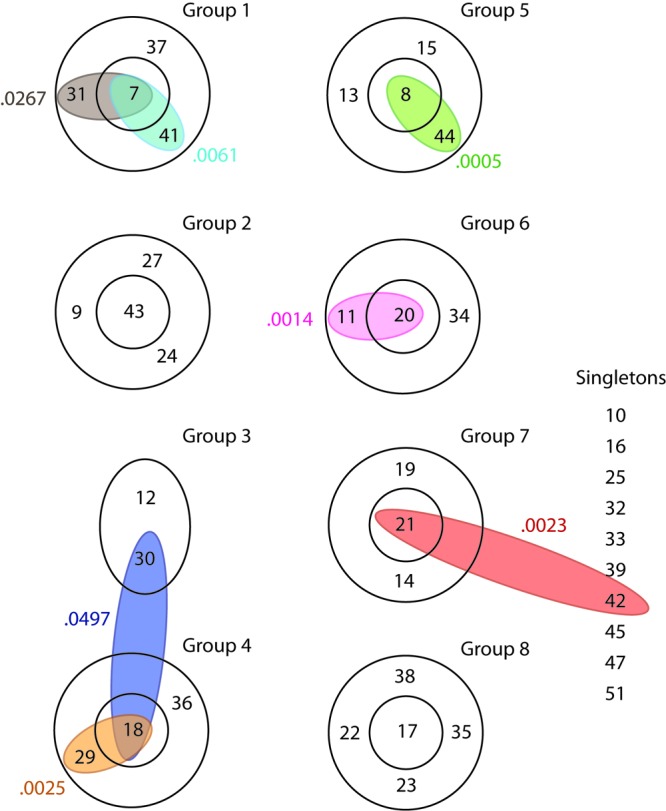
Closely related NSTs share PFGE patterns. BURST analysis revealed the relationships between different NSTs. Within a BURST group, the NSTs in the outer ring differ from the core NST at one of the four CRISPR-MVLST loci. NSTs that could not be assigned to a group are listed as singletons. Individual PFGE patterns that were found in isolates that had different NSTs are shown as colored ovals, and the PFGE pulsotype is indicated by the numbers that follow JJPX01, i.e., JJPX01.0061 is shown as 0.0061.