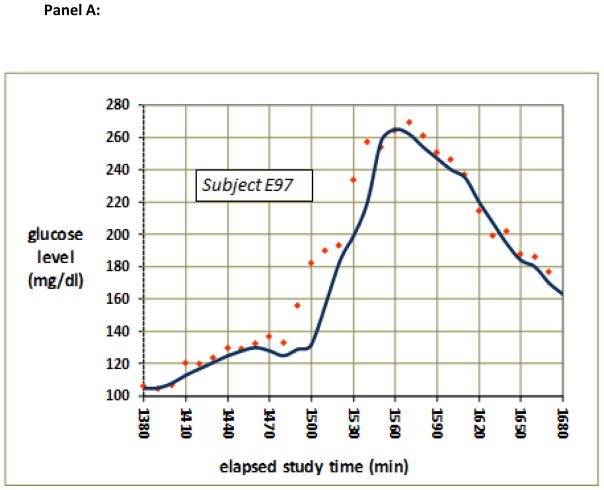
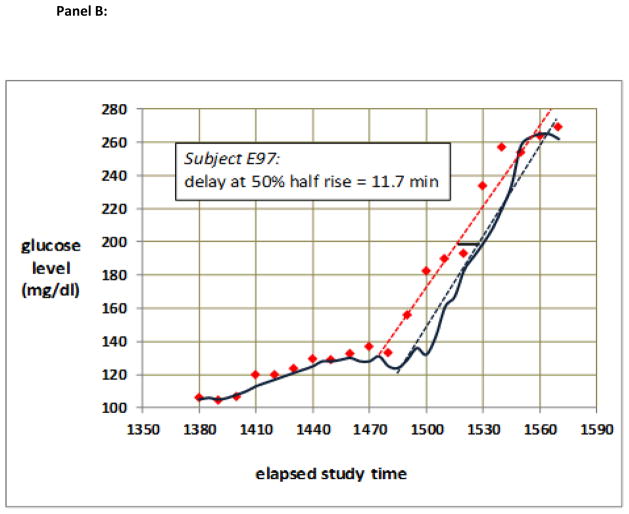
Figure 1.
(a) Typical raw data from a period during which glucose rose then fell. Note that the sensor glucose values (blue) lagged behind blood glucose (red) as glucose was rising, but not as glucose was falling. (b) Quantitative measurement of the lag obtained during rising glucose from the data shown in (a). The time difference between the regression lines for changing blood glucose (dotted red line) and changing sensor glucose (dotted blue line) obtained halfway between the lower plateau and the upper plateau (vertical midpoint) is indicated as the dark horizontal bar, the length of which is calculated to be 11.7 min.


