
Fig. 3.
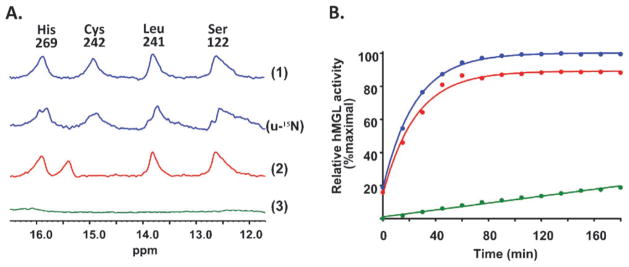
Panel A: Low-field region of the 1D 1H hMGL NMR spectrum. The quartet of peaks is indicative of four hydrogen bonds involving the catalytic triad within the enzyme active site. (1) WT hMGL; (u-15N) u-15N labeled WT hMGL; (2) hMGL C242A mutant; (3) hMGL D239T mutant. The basis for the peak assignments indicated is detailed in the text. Panel B: Best-fit plots of the time-course of WT (blue), C242A mutant (red), and D239T mutant (green) hMGL hydrolytic activity.