
Fig. 5.
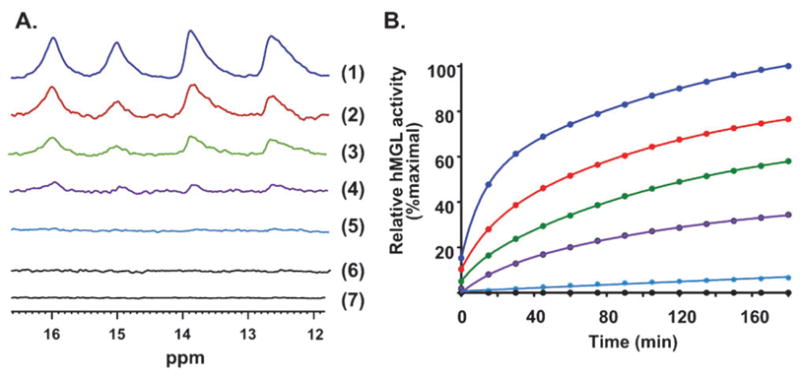
Panel AEffect of the active site-directed covalent inhibitor, NAM, on the low-field NMR spectral region of WT hMGL. Spectra denote the effect of NAM at the following NAM–hMGL molar ratios: 0 : 1 (spectrum 1); 0.25 : 1 (spectrum 2); 0.5 : 1 (spectrum 3); 0.75 : 1 (spectrum 4); 1 : 1 (spectrum 5); 2 : 1 (spectrum 6). Spectrum (7) denotes hMGL with NAM at a 2 : 1 NAM–hMGL molar ratio after a 24 h incubation. Peak assignments are as given in Fig. 3A. Panel B: Best-fit plots of the time-course of WT hMGL hydrolytic activity in the absence (blue) or presence of increasing molar ratios of NAM, as designated by the color-code in Panel A.