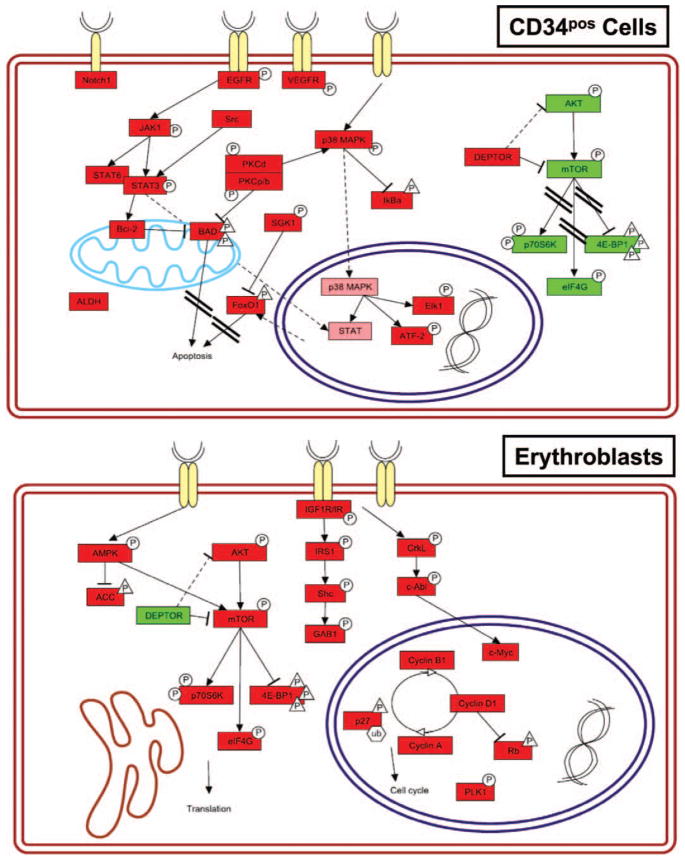
Figure 2.
Signaling pathways activated in cord blood-derived CD34pos hematopoietic progenitor cells (upper panel) and in erythroblasts at day 6 of differentiation (erythroblasts, lower panel). Selected statistically significant proteins are shown. Phosphorylated and total proteins were distinguished as hyperphosphorylated/-expressed (red) and hypophosphorylated/-expressed (green). The shape of the phosphorylations symbols differs for activating (circle) and inhibitory (triangle) phosphorylations. Signaling pathway representation was made with PathVisio v2.0. Nonparametric statistical analysis (Wilcoxon rank sum test) was performed with Jump v5.1 (SAS Institute, Cary, NC) using endpoints relative intensity values. For Wilcoxon analysis, all significant levels were set at p < .05 (for technical details see [37]).

