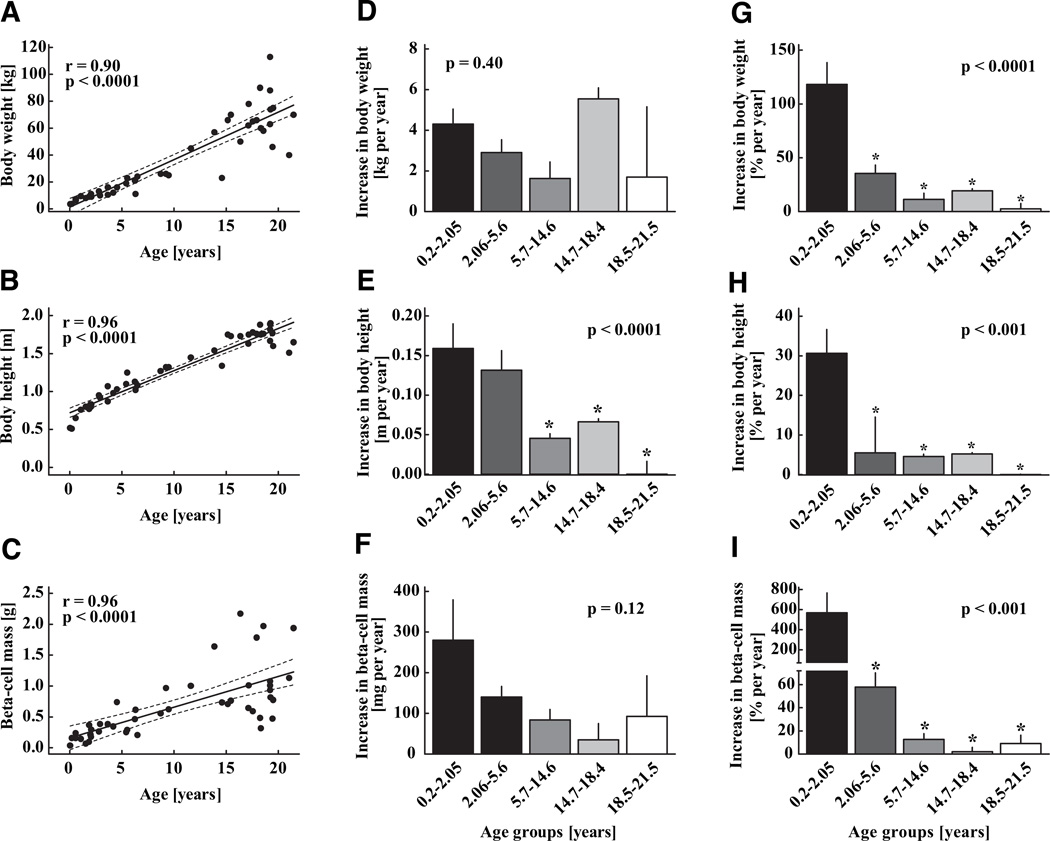
FIG. 8.
Body weight (A), body height (B), and β-cell mass (C) in 46 children aged 2 weeks to 21 years, shown as individual data. Solid lines indicate the regression lines; dashed lines denote the respective upper and lower 95% CIs r and P values were calculated by linear regression analysis. The absolute and relative increase in each parameter is shown as means ± SE on the middle and right panels (D–I) respectively. For these analyses, the group was divided into equal quintiles. Asterisks indicate significant differences versus the youngest age-group, respectively.

