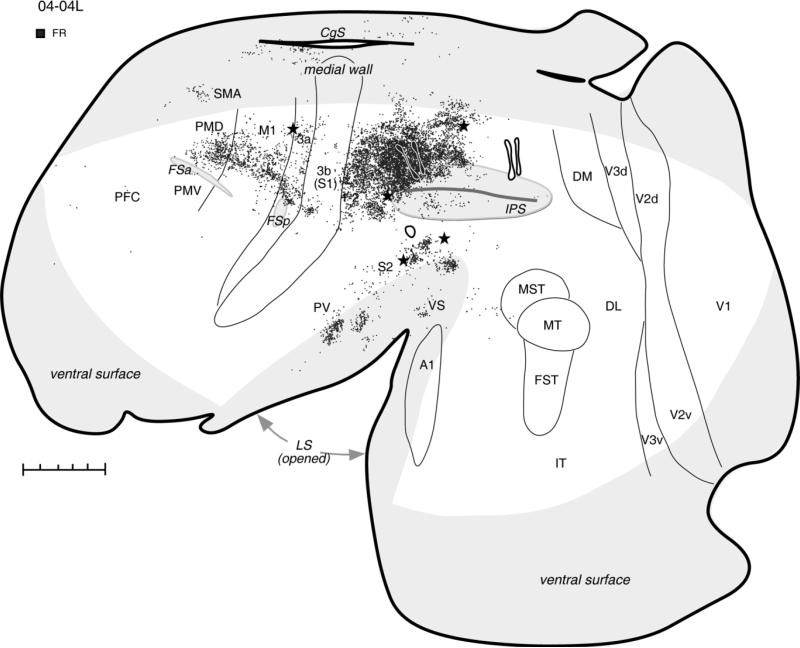
Figure 2.
Distribution of labeled neurons after FR injections (two black spots outlined with white) in the hand-to-mouth zone, shown in a schematic of flattened cortex in case 04-04L. Dots demarcate the location of labeled cells. Injections of two other tracers, BDA in the ventral PPC and FE in the posterior PPC, are also marked for reference. Thin lines indicate the approximate borders of areas defined by physiological mapping and patterns of myelination. Thick lines outline the section or indicate breaks in the section due to sulci. Stars mark electrolytic lesions. For the detailed microstimulation map of this case see Figure 2A in our companion paper. The cortical areas on the medial wall and hidden within the lateral sulcus are shown in light gray. For abbreviations see list. Scale bar = 5 mm.

