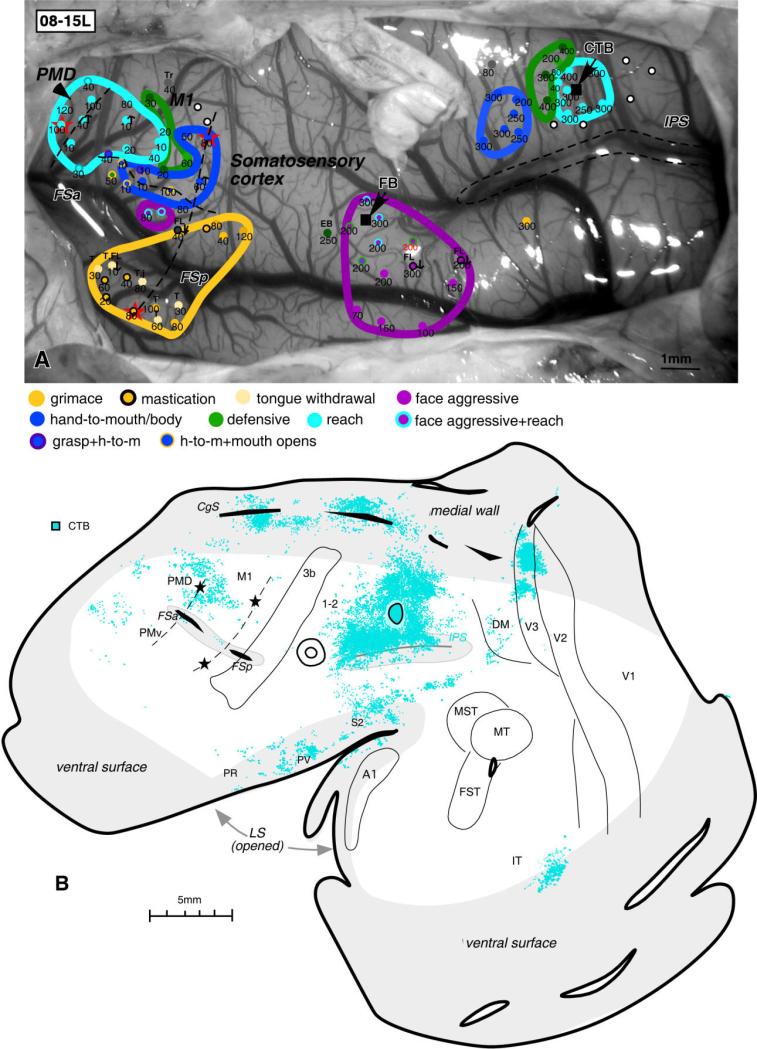
Figure 7.
Pattern of label resulting from injection of tracers into PPC in case 08-15L. A: ICMS map and the location of injections (black squares) shown on the dorsolateral view of the left brain hemisphere. Penetration sites and type of evoked motor response are shown as colored circles. Numbers below indicate the current thresholds. Electrolytic lesions in frontal cortex are shown as red stars. B: Distribution of neurons labeled by CTB injection into the reaching PPC zone. Note the dense label in rostral M1 and caudal PMD (around the marking lesion), from which reaching movements were evoked by ICMS. Other conventions as in Figure 2. CTB, cholera toxin subunit B; E, ear; EB, eye blink; FB, fast blue; FL, forelimb; h-to-m, hand-to-mouth; T, tongue; Tr, trunk. Scale bar = 5 mm.

