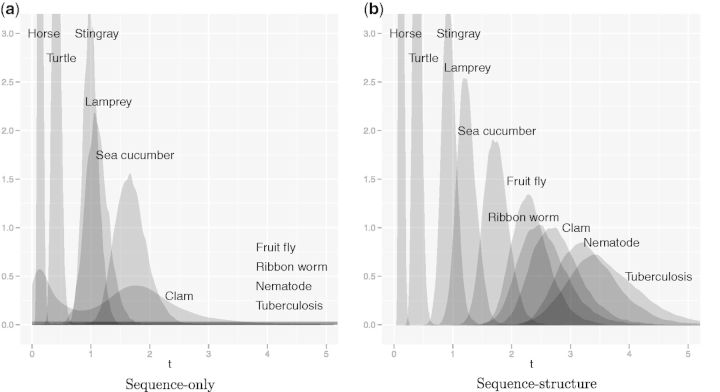
Fig. 1.
Posterior distributions for evolutionary distance between human hemoglobin α and a series of increasingly distant globins, obtained by (a) sequence-only model and (b) combined sequence–structure model. Distributions obtained from both models are nearly identical for the closest three orthologs (horse, turtle and stingray) but begin to diverge beyond this point. The sequence–structure model stochastically orders the proteins according to generally accepted taxonomy, whereas the sequence model begins to underestimate distances with the lamprey and sea cucumber and yields completely flat, uninformative posteriors for the fruit fly, ribbon worm, nematode, and tuberculosis.

