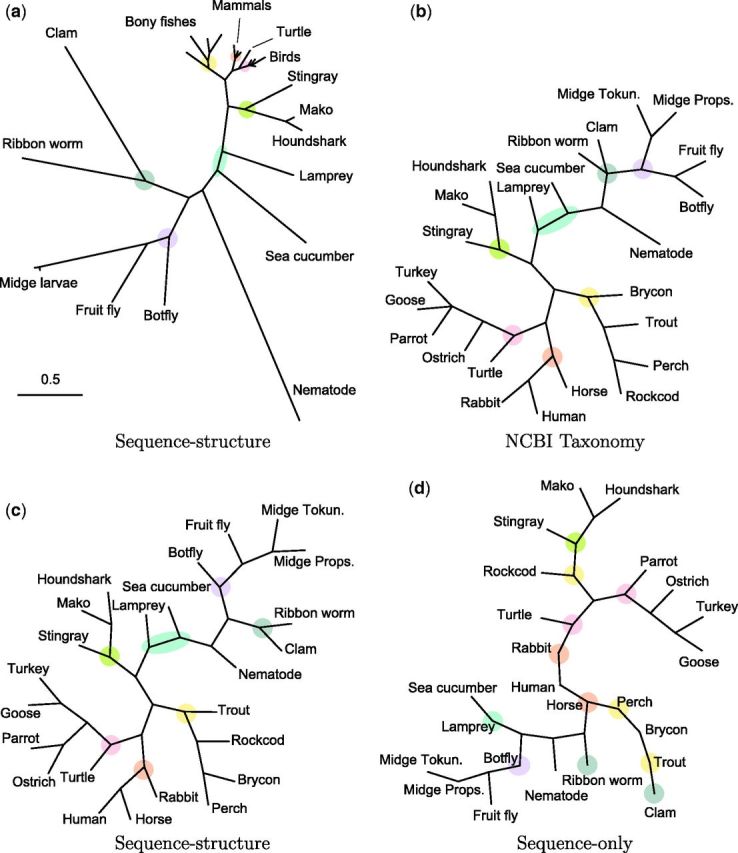
Fig. 4.

Phylogenies for a group of 24 globins (table A1, pairwise sequence identity 12–87%) obtained by different methods. Branch lengths in (b), (c), and (d) have been normalized for topology comparison. (a) Neighbor-joining tree using pairwise posterior mean evolutionary distances under sequence–structure model. (b) Accepted taxonomy (NCBI Taxonomy Database). (c) Topology of (a). Estimated topology closely matches NCBI taxonomy (b), with small differences. (d) Topology of neighbor-joining tree using pairwise posterior mean evolutionary distances under sequence-only model. Some groups are incorrectly separated and several species appear as zero-branch-length intermediate points. Figures are created with TreeView (Page, 1996).
