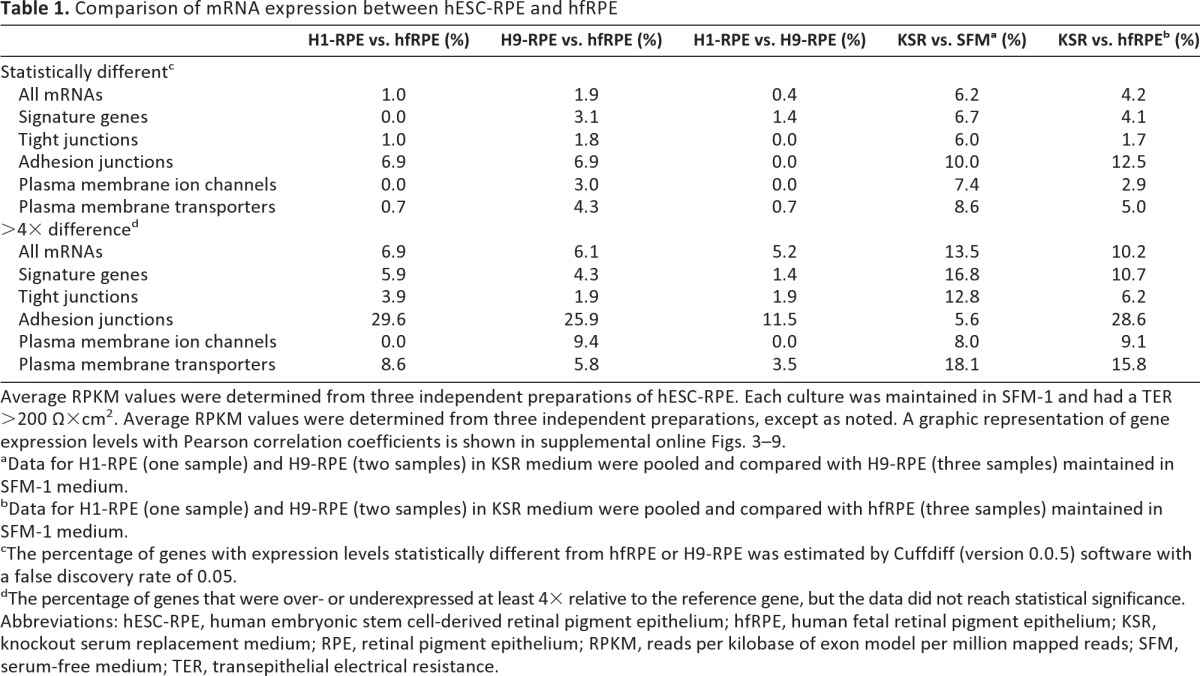
Table 1.
Comparison of mRNA expression between hESC-RPE and hfRPE

Average RPKM values were determined from three independent preparations of hESC-RPE. Each culture was maintained in SFM-1 and had a TER >200 Ω×cm2. Average RPKM values were determined from three independent preparations, except as noted. A graphic representation of gene expression levels with Pearson correlation coefficients is shown in supplemental online Figs. 3–9.
aData for H1-RPE (one sample) and H9-RPE (two samples) in KSR medium were pooled and compared with H9-RPE (three samples) maintained in SFM-1 medium.
bData for H1-RPE (one sample) and H9-RPE (two samples) in KSR medium were pooled and compared with hfRPE (three samples) maintained in SFM-1 medium.
cThe percentage of genes with expression levels statistically different from hfRPE or H9-RPE was estimated by Cuffdiff (version 0.0.5) software with a false discovery rate of 0.05.
dThe percentage of genes that were over- or underexpressed at least 4× relative to the reference gene, but the data did not reach statistical significance.
Abbreviations: hESC-RPE, human embryonic stem cell-derived retinal pigment epithelium; hfRPE, human fetal retinal pigment epithelium; KSR, knockout serum replacement medium; RPE, retinal pigment epithelium; RPKM, reads per kilobase of exon model per million mapped reads; SFM, serum-free medium; TER, transepithelial electrical resistance.
