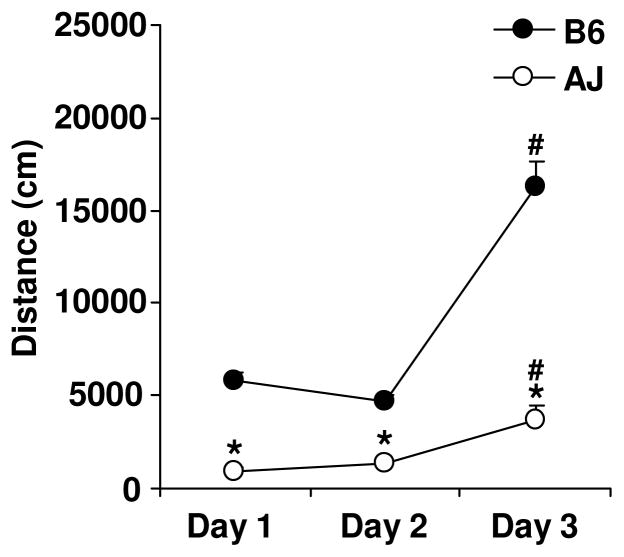
Figure 1. Locomotor response in B6 and A/J.
B6 (N=10 females, 7 males) and A/J mice (N=9 females and 10 males) received saline injections (i.p.) on days 1 and 2 and MA (2 mg/kg, i.p.) on day 3 before placement in the open field. Total distance traveled was recorded over 30 min. Data are presented as the mean ± S.E.M. * = A/J significantly different from B6 for that day. # = significant difference between days 2 and 3.

