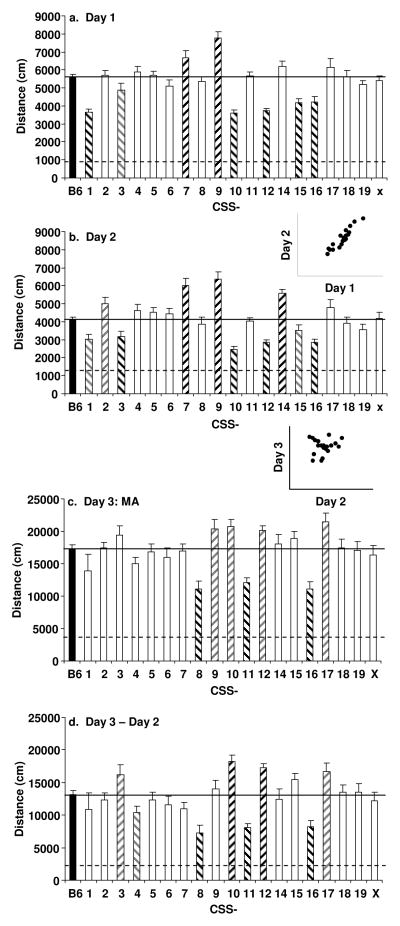
Figure 2. Locomotor response in CSS on days 1, 2, 3 and day 3 minus day 2.
Total distance traveled over 30 minutes is shown for a: day 1 (saline), b: day 2 (saline), c: day 3 (MA; 2 mg/kg, i.p.), and d: day 3 minus day 2. The N for each strain and sex and their mean age ± S.E.M are listed in Table 1. The solid, horizontal line indicates the mean value for B6. The dashed, horizontal line indicates the mean value for A/J. The inset of Panel b illustrates the high degree of correlation between day 1 and day 2 activity (r=0.93; p<0.0001). The inset of Panel d illustrates the lack of correlation between day 3 and day 2 activity. Significant differences as compared to B6 are indicated by a black and white hatched pattern. Suggestive differences are indicated by a gray and white hatched pattern. Data are presented as the mean value for each CSS ± S.E.M.

