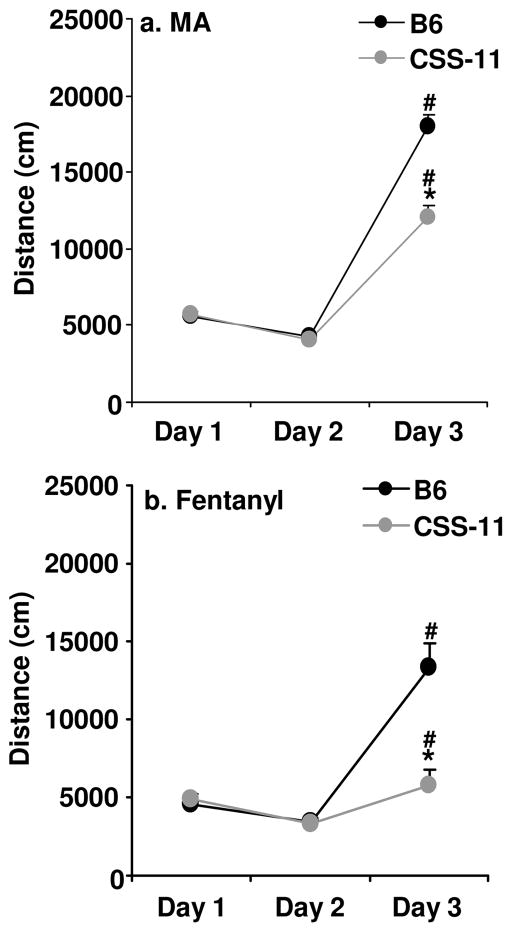
Figure 3. Locomotor response in B6 and CSS-11 to MA and Fentanyl.
Two different cohorts of mice received saline injections on days 1 and 2, and received either MA (2 mg/kg, i.p.; Panel a) or fentanyl (0.2 mg/kg, i.p.; Panel b) on day 3. For panel a, N=23 females, 30 males for B6 (average age = 67.8 ± 0.9) and N=14 females, 23 males for CSS-11 (average age = 64.8 ± 1.8). For panel b, N=5 females, 6 males for B6 (average age = 66.2 ± 1.8) and N=6 females, 4 males for CSS-11 (average age = 69.6 ± 0.7). Total distance traveled was recorded over 30 min. Data are presented as the mean ± S.E.M. * = CSS-11 significantly different from B6 for that day. # = significant difference between days 2 and 3.

