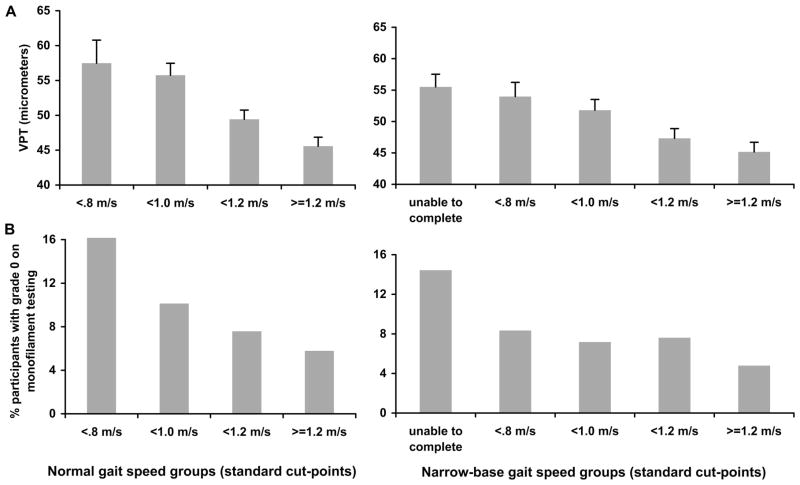
FIGURE 1.
Mean vibration perception thresholds (SEM) according to normal gait speed groups and narrow-base gait speed groups using standard cut-points (A). Percent of participants who did not perceive either of the monofilaments (grade 0) according to normal gait speed groups and narrow-base gait speed groups using standard cut-points (B).

