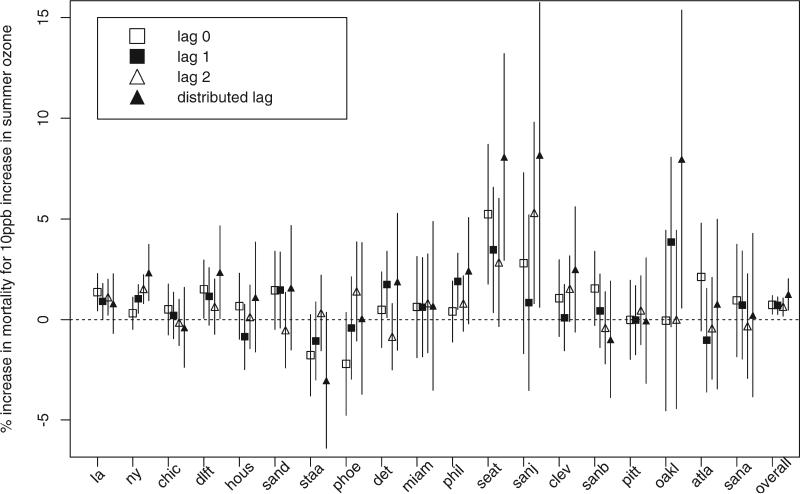
Figure 3.
City-specific relative rates estimates (percent increases in CVDRESP mortality associated with 10ppb increase in ozone) and their 95 per cent confidence intervals, with overall ozone effect and its 95 per cent posterior regions at the end. These effects are estimated by use of a distributed lag model for one week and at lags 0, 1 and 2 days

