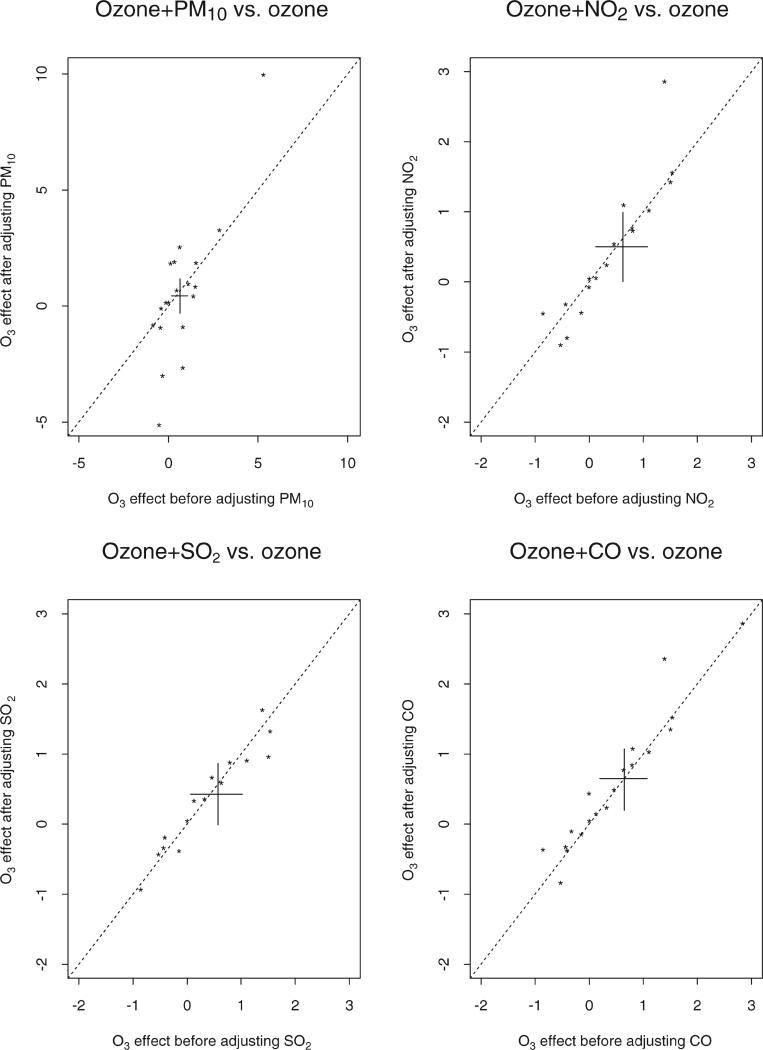
Figure 5.
City-specific ozone relative rates estimates at lag 2 adjusted by another pollutant (PM10, NO2, SO2 or CO), plotted against ozone relative rates estimates at lag 2. The cross is plotted corresponding to the two overall relative rates (adjusted versus unadjusted) and their 95 per cent posterior regions

