Figure 1.
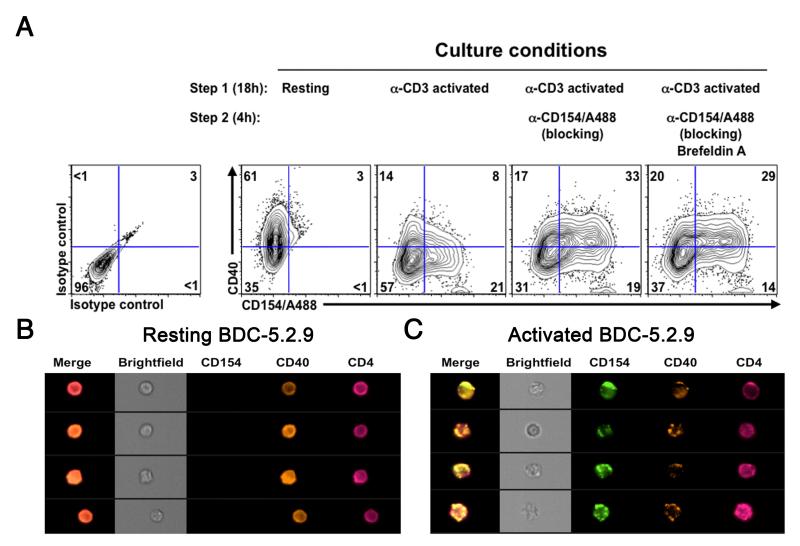
CD40 and CD154 are co-expressed on T cells upon activation. (A) The diabetogenic T cell clone BDC-5.2.9 was analyzed at resting state (first panel) or was activated with immobilized anti-CD3 antibody (2 μg/ml). Cells were harvested and resuspended in original media (second panel) supplemented with anti-CD154/A488 (10 μg/ml) (third panel) or anti-CD154/A488 and Brefeldin A (GolgiPlug) (far right panel) and cultured at 37°C for an additional 4 hr. Cells were then harvested and stained with anti-CD154/A488, anti-CD40 PE and anti-CD4 PerCP-Cy5.5 antibodies or appropriate isotype control antibodies. Expression of CD40, CD154 and CD4 was then monitored by flow cytometry. Data is representative of a least 3 independent experiments. Gates were set on live/CD4 cells and quadrants were set according to isotype control staining. (B) Resting BDC-5.2.9 T cell clones were analyzed on an ImageStream Flow cytometer and representative images of CD4+CD40+ T cells are represented. (C) ImageStream analysis of the BDC-5.2.9 T cell clone after activation in the presence of anti-CD154/A488. Representative images of T cells expressing both CD40 and CD154 are shown.

