Figure 5.
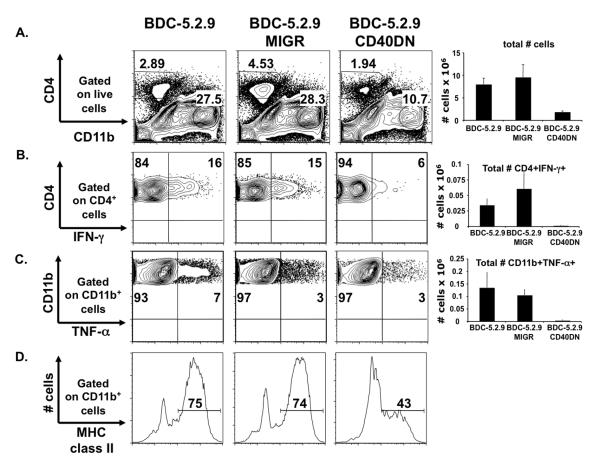
Effect of CD40 signaling blockade on pancreatic infiltrate through ex vivo analysis. BDC-5.2.9, BDC-5.2.9 MIGR, and BDC-5.2.9 CD40DN (1 × 10⁷) were expanded in subcultures and were injected i.p. into 10-day-old NOD.scid recipients. Six days after transfer, pancreatic single cell suspensions were prepared, counted, and then incubated at 37°C in the presence of Brefeldin A for 3 h. Cells were analyzed by flow cytometry for CD4, CD11b, TNF-α, IFN-γ and MHC class II expression. (A) The percentage of CD4 and CD11b cells were monitored on live gates. Absolute numbers of infiltrating T cells are represented. (B) IFN-γ production was monitored by ICS on CD4+ cells. Absolute number of CD4+IFN-γ + cells are represented. (C) TNF-α production was monitored by ICS on infiltrating CD11b+ cells. Absolute number of CD11b+TNF-α+ cells are represented. (D) Expression of MHC class II was assessed on CD11b+ cells. Gates were set on live cells and quadrants were set according to isotype control staining. Results are from one experiment with 2 NOD.scid recipient mice for each clone. The data (not shown) are similar to those obtained in the same experiments performed in immunocompetent NOD mice.

