
Fig. 1.
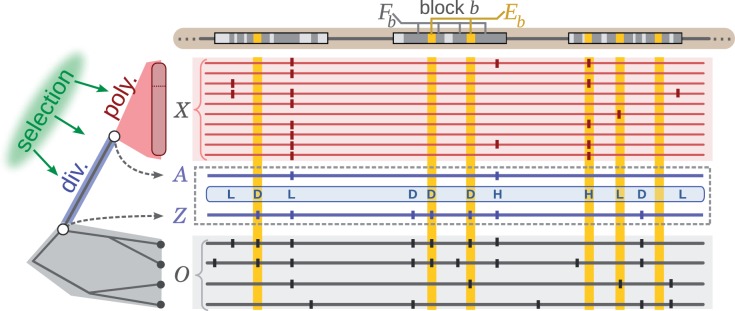
Schematic description of INSIGHT. The method measures the influence of natural selection by contrasting patterns of polymorphism and divergence in a collection of genomic elements of interest (gold) with those in flanking neutral sites (dark gray). Nucleotide sites in both elements (Eb) and flanks (Fb) are grouped into genomic blocks of a few kilobases in length (b) to accommodate variation along the genome in mutation rate and coalescence time. The model consists of phylogenetic (gray), recent divergence (blue), and intraspecies polymorphism (red) components, which are applied to genome sequences for the target population (X, red) and outgroup species (O, gray). At each nucleotide position, the alleles at the MRCA of the samples from the target population (A) and of the target population and closest outgroup (Z) are represented as hidden variables and treated probabilistically during inference. The allele Z determines whether monomorphic sites are considered to be divergent (D). Polymorphic sites are classified as having low- (L) or high- (H) frequency–derived alleles based on A and a frequency threshold f. The labels shown here are based on a likely setting of Z and A. Vertical ticks represent single nucleotide variants relative to an arbitrary reference. Inference is based on differences in the patterns of polymorphism and divergence expected at neutral and selected sites.