
Figure 3. Co-localization of actin filaments and focal adhesions in circular cells.
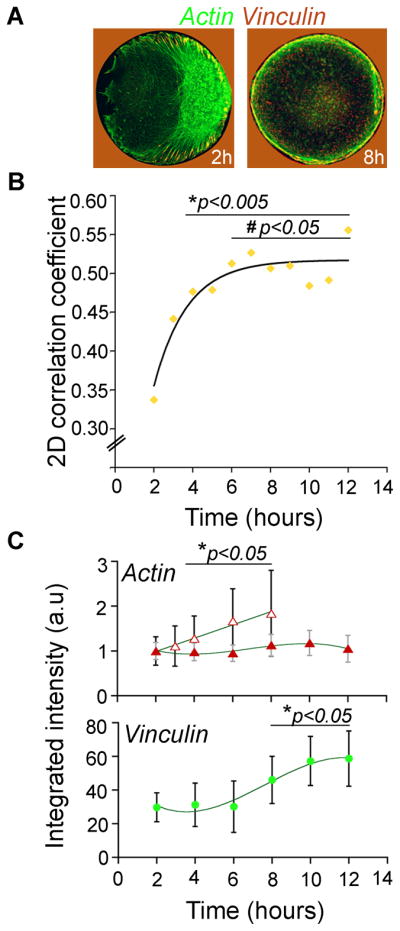
(A) Overlays of actin (green) and vinculin (red) 2 and 8-hr images showing extent of colocalization of the two structures (note that red background surrounding the islands/cells is due to the signal from gold, not from vinculin); island diameter, 40 μm. (B) Quantification of the colocalization of actin filaments and focal adhesions from 25 individual images (representative images also shown in Fig. 2A,B). Standard deviations are ~13–21% of the average values for 3–12 hrs, and ~30% for the 2-hr point. Statistical comparisons were carried out by using Analyse-It software package (ANOVA, Bonferoni post-hoc test); all subsequent points were compared to 2h-point (*p<0.005 for 4–12 hrs); or to 3-h-point (# p<0.05 for 6–12 hrs). (C) Quantification of integrated intensity levels of actin and vinculin images. Intensity levels reflect the total amount/area of focal adhesions. Data are represented as mean +/− standard deviation; *denotes p <0.05, all subsequent points were compared to the initial 2h-point.