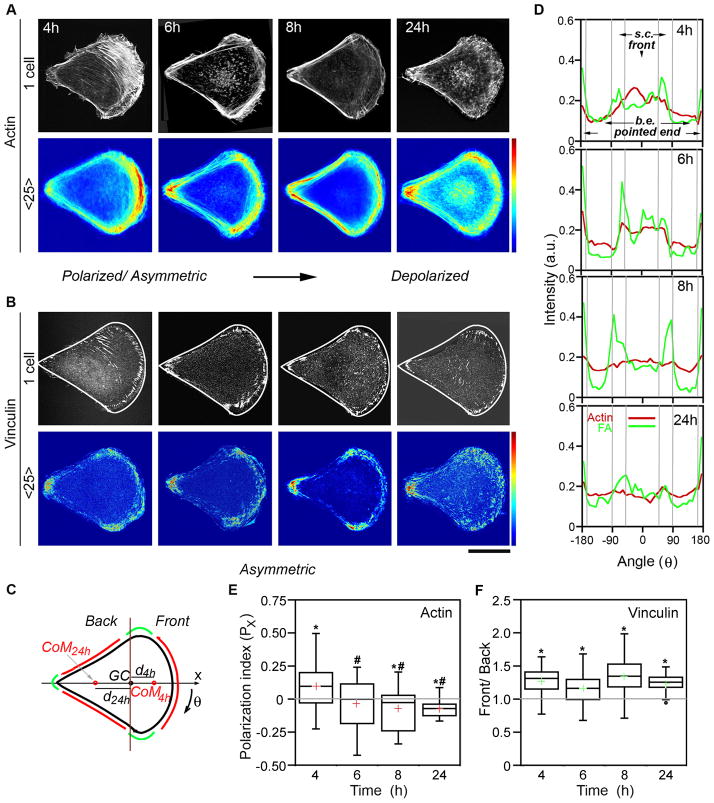
Figure 5. Temporal reorganization of actin filaments and focal adhesions in tear-drop cells.
Representative single (black-and-white images, top row) and average (heat maps, bottom row, 25 cells; scale from 0 to 250, arbitrary intensity units) images of (A) actin filament (from fluorescent phalloidin staining) and (B) focal adhesion (vinculin, FA) distributions in cells cultured on fibronectin-coated, tear-drop microislands (area, 1256 μm2). White lines in individual cell images in B show tear-drop shape of the adhesive islands. Scale bar = 20 μm. (C) Scheme of the tear-drop shape with the arrow indicating the x-direction along which polarization occurs and polarization index, Px is calculated. The regions indicated correspond to those in intensity scans in D: Red, back edges (b.e.) and the front; green, side corners (s.c.) and pointed end (also high curvature points that typically accumulate FAs). GC, geometric center of the cell; CoM, center of mass of f-actin or FAs; dx, distance between GM and CoM. Note that dx can have positive (4h, most f-actin towards wide end) or negative (24h, most f-actin towards pointed end) values (D) Quantification of the intensity within 5-μm-thick outer rims of average images shown in A and B. Angular distributions of actin (red) and FAs (green, vinculin). (E) Quantification of f-actin (using images from A, n = 25–50 cells) by means of the polarization index, Px where Px is computed as dx divided by radius, R, of circular cell of corresponding area (here, R=20 μm). (F) Quantification of FA distributions (using images from B) by means of Front/Back ratio of peripheral FAs. Top and bottom of the boxes show 75th and 25th quartiles, respectively; whiskers indicate minimum and maximum values; middle line is the median and cross is the mean. An asterisk (*) indicates statistically significant difference when compared to 0 for Px (p<0.05) or 1 for Front/Back ratio (p<0.001) (or symmetric distribution). Pound symbol (#) indicates significant (p<0.05) difference when compared with initial time-point (4h). Actin distribution is polarized and oriented towards wide end in short-term followed by actin rearrangement and “depolarization” (or slight polarization towards pointed end), while FA distributions remain asymmetric for long times.

