Figure 3.

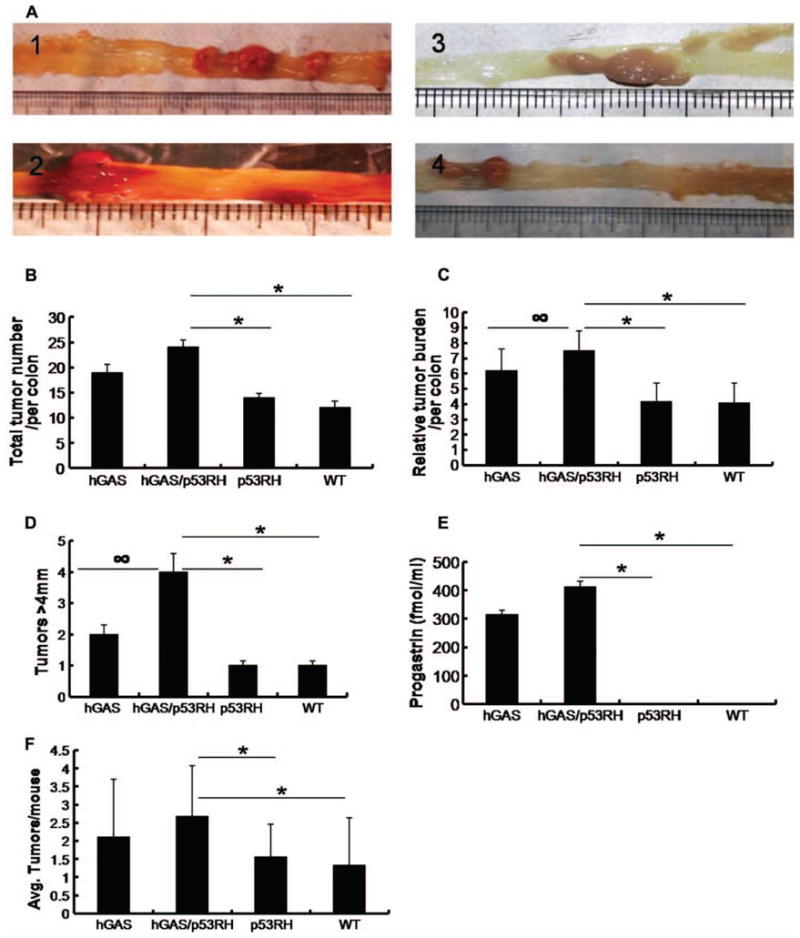
Colon tumor study. (A) Macroscopic changes and tumor formation in colons of mice from each group. Colons were removed at 30 weeks age after 6 weeks of AOM treatment. Representative results from four independent animals are shown: (1) hGAS/+, (2) hGAS/p53RH, (3) p53RH, and (4) WT mice. (B) Total tumor numbers in the colons of experimental mice. (*p < .03). (C) Relative tumor burden per animal colon (∞p = 0.11, *p < .03). (D) Graph showing the distribution of tumors larger than 5 mm (∞ p = 0.13, *p < .03). (E) Concentration of progastrin levels in the serum of AOM treated mice (*p < .03). Serum was collected at around thirty weeks of age and progastrin levels were calculated by radioimmunoassay. (F) Average tumor numbers per colon in all four groups (*p < .03).
