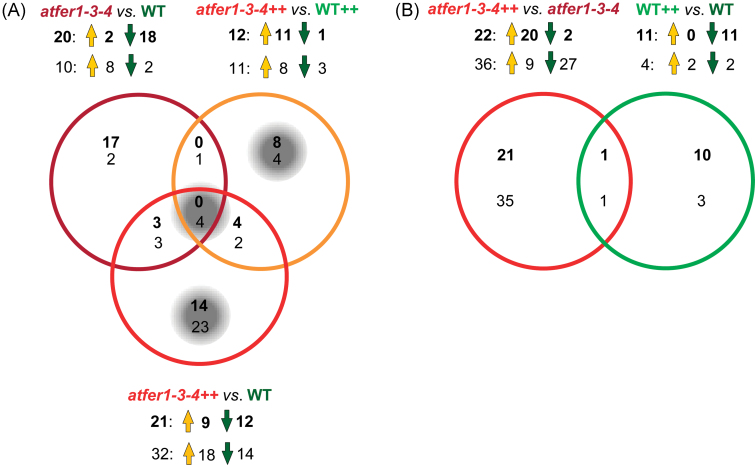
Fig. 4.
Venn diagrams indicating major changes in Arabidopsis flower proteins and metabolites. Overlapping regulation is shown by Venn diagrams. Numbers indicate protein species (bold) and metabolites (regular) with significant and >2-fold changes in response ratios (i.e. abundance); up- and down-accumulation is indicated by orange and green arrows, respectively (for fold changes see Table 4). (A) Species showing differences in relative abundance in flowers of atfer1-3-4 versus WT, atfer1-3-4++ versus WT++, and atfer1-3-4++ versus WT. Groups of interest discussed in the text are highlighted by a grey background. (B) Species showing differences in relative abundance in flowers of in atfer1-3-4++ versus atfer1-3-4 and WT++ versus WT.

