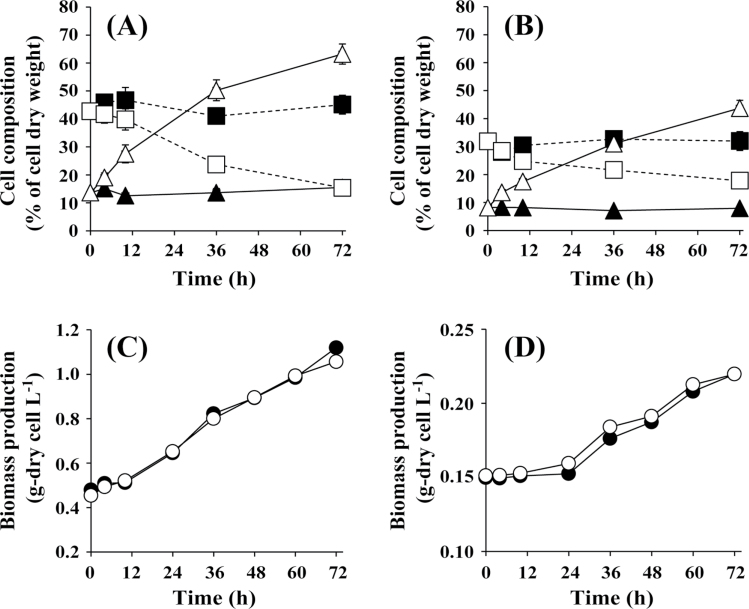
Fig. 1.
Time-course analysis of the glycogen (triangles) and protein (squares) content of A. platensis (A) and Synechocystis sp. PCC6803 (B) cells, and concentration of A. platensis (C) and Synechocystis sp. PCC6803 (D) biomass during cultivation in the presence (closed symbols) and absence (open symbols) of nitrate.

